The operating model
Small-bay refuses a simple size label.
A 240,000-square-foot business park can contain twenty 12,000-square-foot buildings and eighty tenants. A 170,000-square-foot distribution building can contain one tenant on a long-term net lease.
The first can be a classic small-bay operating business. The second can behave more like a bond wrapped in concrete and loading doors.
The important distinction is not simply how much real estate sits inside the collateral. It is how that real estate makes money.
The comparison uses flex designation, average building and tenant size, concentration, component-property count, drive-in doors, and clear height. Total size matters, but it does not decide the category by itself.
A useful contradiction
A 1.4-million-square-foot park can still be small-bay.
Century Business Center in Hawthorne, California, contains approximately 1.4 million square feet across 21 buildings. The average building is about 67,000 square feet, and the collateral is identified as flex.
The tape also includes a 1.08-million-square-foot portfolio divided among 62 collateral properties, an 877,000-square-foot Chicago infill portfolio across 12 properties, and a 277,000-square-foot Kenosha property with 13 buildings averaging about 21,000 square feet.
At the other end sits a 169,700-square-foot FedEx distribution property where FedEx occupies approximately 78% of the space. It is smaller in total area but does not operate like a granular small-bay park.
What qualifies
25
operating small-bay/flex properties in the comparison exceed 200,000 square feet.
3
exceed 500,000 square feet because total size is not the operating definition.
The comparison
Small-bay wins income density. Large-format keeps more of each revenue dollar.
The CMBS warehouse contains 3,449 industrial properties in the performance snapshot. The headline comparison uses 708 operating small-bay/flex properties and 94 known large-building properties. Another 1,647 smaller properties remain unresolved because size alone is not enough evidence.
| Metric | Operating small-bay/flex | Known large-building |
|---|---|---|
| Properties | 708 | 94 |
| Total area—median / average | 71,150 / 89,000 SF | 417,300 / 573,300 SF |
| Average building area—median / average | 36,500 / 45,000 SF | 332,700 / 398,900 SF |
| Securitization NOI/SF—median / average | $7.84 / $8.48 | $4.58 / $5.22 |
| Latest annual NOI/SF—median / average | $9.44 / $10.64 | $5.21 / $6.44 |
| Latest NOI margin—median / average | 67.2% / 65.6% | 71.6% / 73.7% |
| Current DSCR—median / average | 2.11x / 2.38x | 2.19x / 2.75x |
| Day-one cap rate—median / average | 6.69% / 6.72% | 6.30% / 6.49% |
Average-building figures use properties with a usable building count: 359 operating small-bay properties and all 94 known large-building properties.
Why the premium exists
Industrial space is priced in pieces.
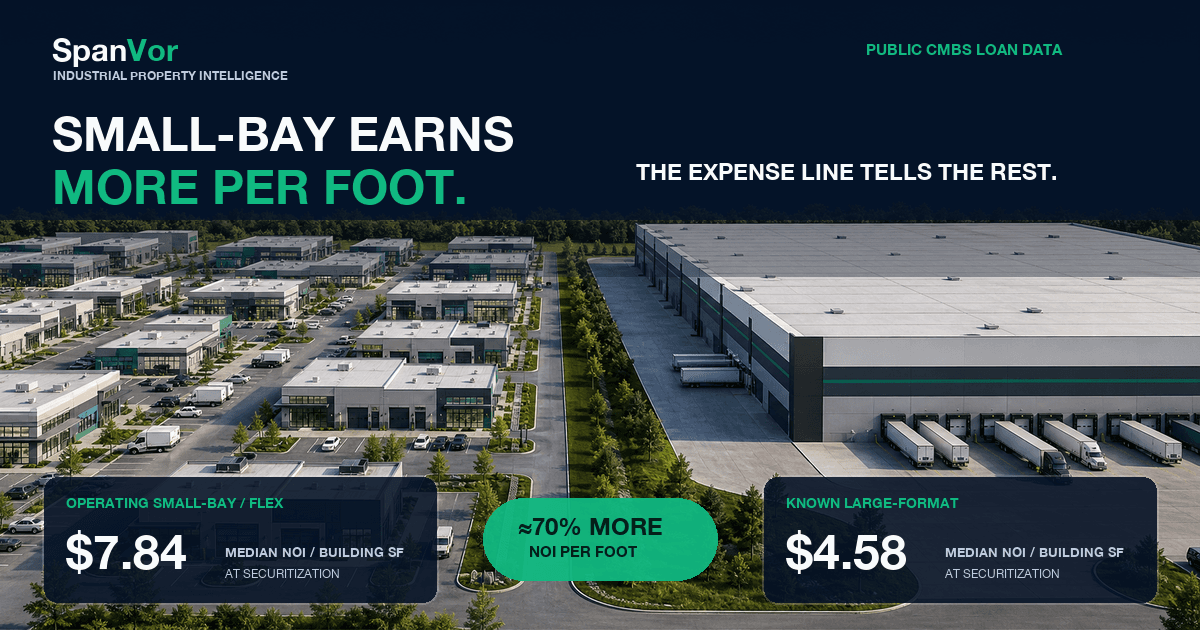
The median small-bay property entered securitization at approximately $7.84 of NOI per building square foot, versus about $4.58 for a known large building—a roughly 71% premium.
A local operator leasing 5,000 square feet generally pays more per foot than a national company taking 500,000. A park with ten buildings and forty suites can reprice smaller portions of its rent roll repeatedly.
That granularity creates more pricing events. It also creates more payroll, repairs, collections, turnovers, common areas, leasing costs, and daily decisions.
The work is not incidental to the return. The work creates the return.
Where the advantage went
Small-bay revenue grew faster. Expenses grew faster still.
| Annualized growth | Operating small-bay/flex | Known large-building |
|---|---|---|
| Property revenue—median / average | 3.48% / 3.83% | 2.21% / 2.75% |
| Operating expenses—median / average | 7.18% / 8.17% | 4.53% / 6.59% |
| NOI—median / average | 2.63% / 2.76% | 3.04% / 3.54% |
| Usable revenue / expense / NOI observations | 219 / 212 / 212 | 33 / 28 / 35 |
From securitization to the latest comparable observation, median property-revenue growth was approximately 3.5% for operating small-bay and 2.2% for known large buildings. But small-bay expenses grew about 7.2%, versus 4.5%.
By the time the additional revenue reached NOI, the large buildings had caught up and moved ahead. The rent-and-revenue opportunity was real. Capturing it required controlling expenses.
The cycle
The small-bay advantage peaked before the expense acceleration.
| Fiscal year | Small-bay revenue | Small-bay expenses | Small-bay NOI | Large-building NOI |
|---|---|---|---|---|
| 2020 | 1.6% | -1.1% | 2.3% | 2.2% |
| 2021 | 4.2% | 5.9% | 2.8% | 2.0% |
| 2022 | 4.7% | 4.1% | 3.6% | 3.5% |
| 2023 | 4.0% | 4.7% | 5.0% | 2.0% |
| 2024 | 3.1% | 7.4% | 1.7% | 0.9% |
| 2025 | 2.4% | 2.7% | 1.6% | 0.3% |
Small-bay had an excellent run from 2021 through 2023. Revenue grew, and 2023 median NOI growth reached approximately 5%.
Then expenses accelerated in 2024 while revenue growth slowed. Insurance, taxes, repairs, payroll, utilities, and turnover do not care that the new lease was signed at a higher rent.
The weak-coverage tail
Does value-add explain the loans below 1.25x?
Partly—but it cannot carry the whole explanation.
Value-add buyers can accept thin day-one coverage because they expect lease-up, frequent renewals, or a faster mark-to-market. The detailed filings contain acquisition plans, renovations, reserves, and real examples of in-place rents below appraisal market rents.
But the properties currently below 1.25x do not look, as a group, like business plans waiting patiently to work. They lost occupancy and revenue while expenses kept climbing.
| Median result | Below 1.25x | At or above 1.25x |
|---|---|---|
| DSCR at securitization | 1.67x | 1.92x |
| Current DSCR | 0.97x | 2.32x |
| Occupancy at securitization | 100% | 100% |
| Current occupancy | 94% | 100% |
| Property-revenue growth | -0.86% | 4.74% |
| Expense growth | 7.43% | 7.18% |
| NOI growth | -8.63% | 4.16% |
| Day-one LTV | 65.0% | 61.6% |
A mark-to-market plan is not a result until the revenue shows up and survives the expense line.
A third industrial category
NNN is not small-bay—and single-tenant is not automatically NNN.
In the detailed A1-linked subset, at least 530 properties below 200,000 square feet were confirmed single-tenant or at least 90% concentrated in one tenant. That does not make all 530 NNN. It proves that “below 200,000 square feet” is not a tenancy model.
Precise Space · Rhome, Texas
A genuine operating property with commercial-van, utility, pickleball, baseball, CrossFit, and custom-automotive users.
540 Tech Center · Raleigh
A 111,000-square-foot flex property with three tenants and in-place rents around $19 to $20 per foot against an appraisal market indication near $21.
2000 Corporate Center · Thousand Oaks
Approximately 105,000 square feet, but two tenants—ALE USA and Tesla—occupy roughly half apiece. Smaller flex is not automatically granular small-bay.
FedEx Distribution Center · New Jersey
Approximately 170,000 square feet with FedEx occupying roughly 78%. The size is smaller; the operating model remains concentrated distribution.
Fresh Edge Portfolio · Indianapolis
Full occupancy and no reported operating expenses in the extracted underwriting summary—an obvious net-lease classification question.
1301 Rocky Point Drive · Oceanside
An approximately 97% underwritten NOI margin, reinforcing why lease structure can matter more than total area.
The useful framework has four buckets: operating small-bay/flex, single-tenant or net-lease industrial, large-format industrial, and unresolved.
Market signals
The markets are not keeping the premium equally well.
| State cut | Properties | Revenue growth | Expense growth | NOI growth |
|---|---|---|---|---|
| Nevada | 12 | 8.8% | 5.7% | 8.5% |
| California | 58 | 4.8% | 3.2% | 5.2% |
| Texas | 35 | 4.6% | 5.7% | 4.1% |
| Florida | 48 | 3.3% | 6.7% | 1.1% |
| Illinois | 14 | 2.7% | 8.8% | 0.5% |
Nevada is the most striking result, driven largely by Las Vegas, but twelve properties are not enough for a sweeping claim. California and Texas are the cleaner outperformers.
Florida and Illinois tell the opposite story. Revenue generally rose, but expenses rose much faster. Those markets did not lack opportunity. They struggled to keep it.
What to underwrite harder
Spend less time debating the next rent dollar. Ask what it costs to collect it.
- 01Which expenses are truly recoverable, and how quickly do reimbursements reset?
- 02Are leases using accurate pro-rata shares?
- 03How much of the insurance and tax increase actually reaches tenants?
- 04What does a routine suite turnover cost after paint, HVAC, doors, office buildout, and leasing commissions?
- 05Is the property staffed for forty small relationships—or underwritten as though it has four?
- 06How many leases roll before the rent mark can be realized?
- 07Does the debt leave room for the uneven path between today's occupancy and the business plan?
The bottom line
Small-bay is a dense income machine.
It should not be defined by a size ceiling, valued like a passive warehouse, or operated as though forty tenants behave like one.
The revenue premium is the opportunity. The expense line is the job.
Download the nine-page reportQuestions readers ask
How does this report define small-bay industrial?
It uses affirmative operating evidence such as flex designation, average building and tenant size, tenant concentration, component-property size, drive-in doors, and clear height. Total collateral size is descriptive but is not capped.
Did operating small-bay earn more per square foot?
Yes in this public CMBS comparison. Median securitization NOI was approximately $7.84 per building square foot for operating small-bay/flex and $4.58 for the known large-building group, a difference of roughly 71%.
Does a lower DSCR simply mean the property is value-add?
Not automatically. Value-add plans can begin with thinner coverage, but the below-1.25x group in this sample also showed declining revenue, lower occupancy, and negative NOI growth as expenses continued rising.
Is every single-tenant industrial property NNN?
No. Tenant concentration and lease structure are different facts. A single tenant can leave costs with the landlord, while a multi-tenant park can use net leases. The available CMBS lease-structure coverage supports case studies but not a complete national NNN comparison.
About the data
A public loan-tape view—not the entire industrial market.
This analysis uses public SEC Form ABS-EE commercial-mortgage asset data and detailed Annex A exhibits assembled in SpanVor's CMBS warehouse. The performance snapshot contains 3,449 industrial properties and extends through July 13, 2026. Detailed A1 descriptions extend through July 9; the current A3 top-loan set extends through June 22.
Growth results require comparable observations and exclude implausible values. “Property revenue” can include rent, reimbursements, occupancy changes, and other income; it is not presented as a pure contractual-rent series. Tenancy and lease-structure coverage is strongest for top loans and incomplete across the full tape.
CMBS data does not consistently disclose acquisition equity, later capital expenditures, distributions, or sale proceeds. This report evaluates operating and credit performance—not investor IRR or total return. It is research and commentary, not investment advice.