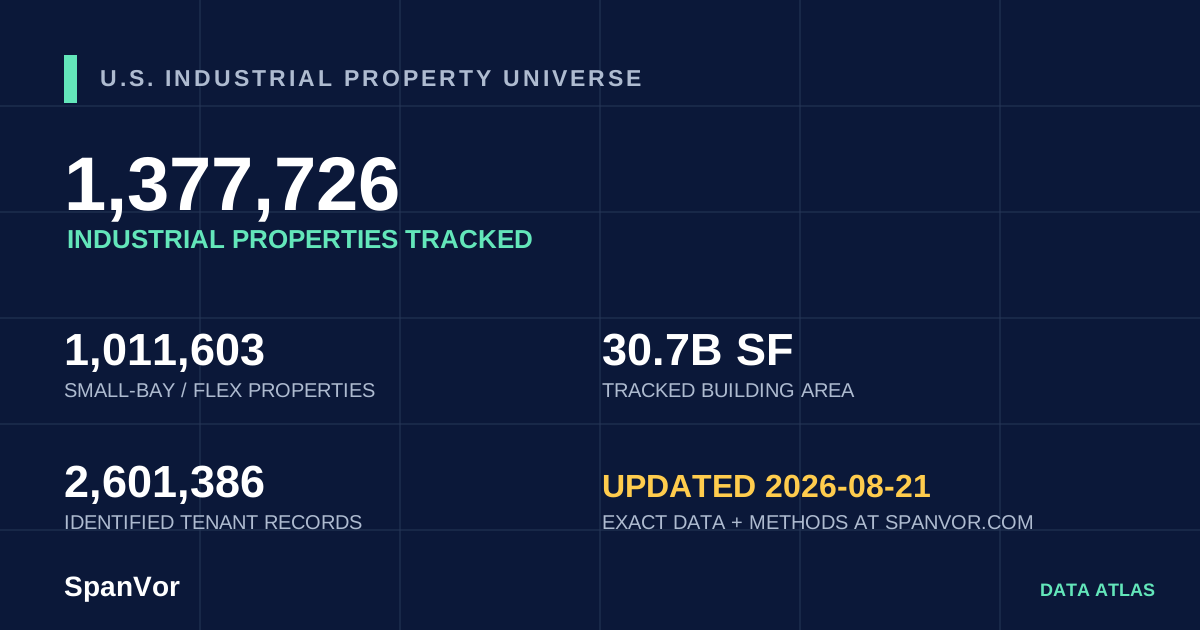
National totals and market comparisons for property counts, small-bay classification, building area, tenant observations, assessed-value coverage, and IOS candidates.
CSV · JSON · ChartSpanVor
Industrial intelligenceNational → State → Metro → Property
Public aggregate library
Download the evidence.
Stable, versioned aggregate data for research, reporting, education, and economic-development work. Exact proprietary project, tenant, owner, contact, and source-document records remain in SpanVor Pro.
Current releases
Different datasets. Different questions.
Existing industrial inventory and new development are separate data products. They should not be combined without preserving their different definitions and coverage.
Measured, non-overlapping market cohorts with project counts, coverage boundaries, small-bay counts where available, and source-stated building area.
CSV · JSON · Chart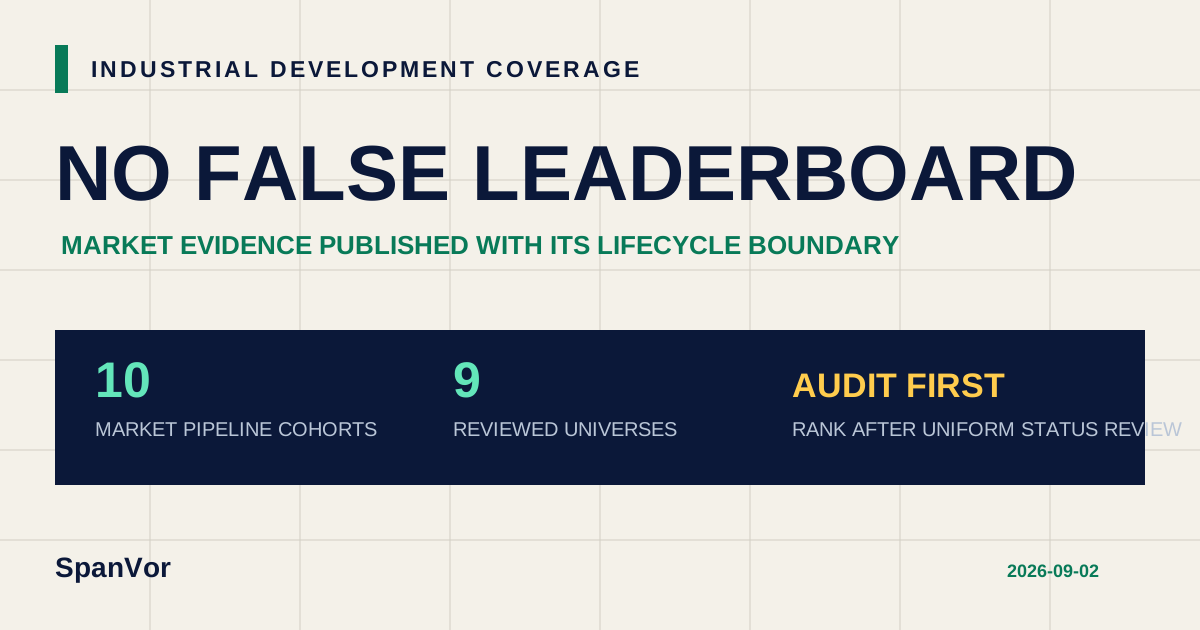
Statewide inventory and exact county aggregates for industrial property records, small-bay classification, building area, tenant observations, value coverage, and IOS candidates.
CSV · JSON · Chart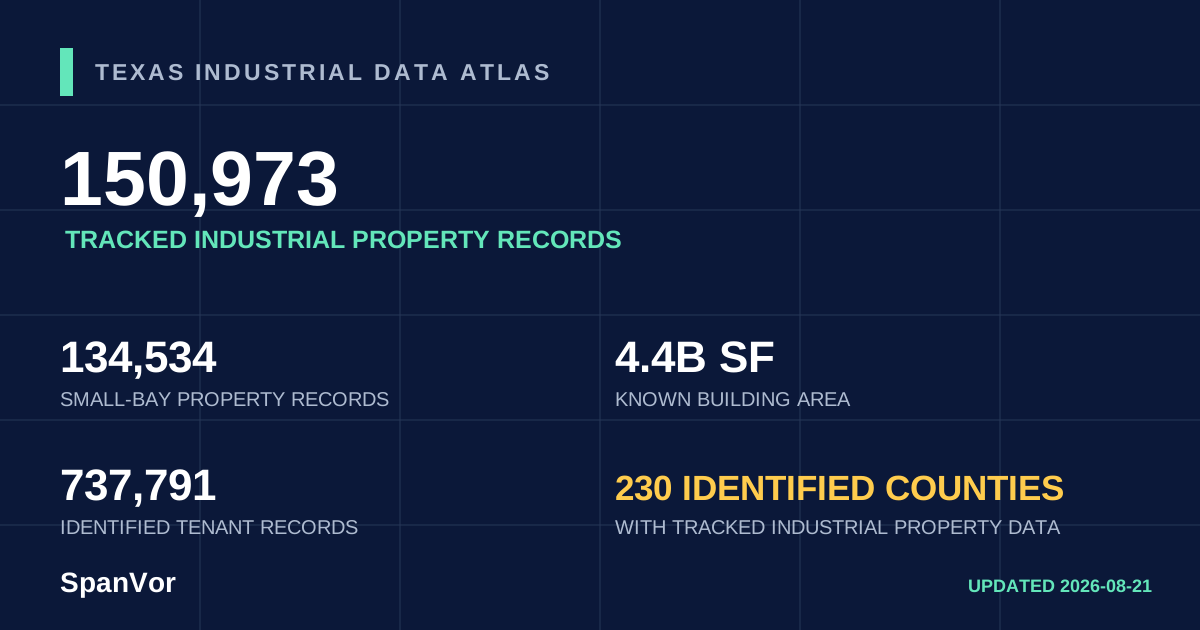
Nine-county inventory plus separately scoped industrial pipeline and residential-demand measures.
CSV · JSON · Chart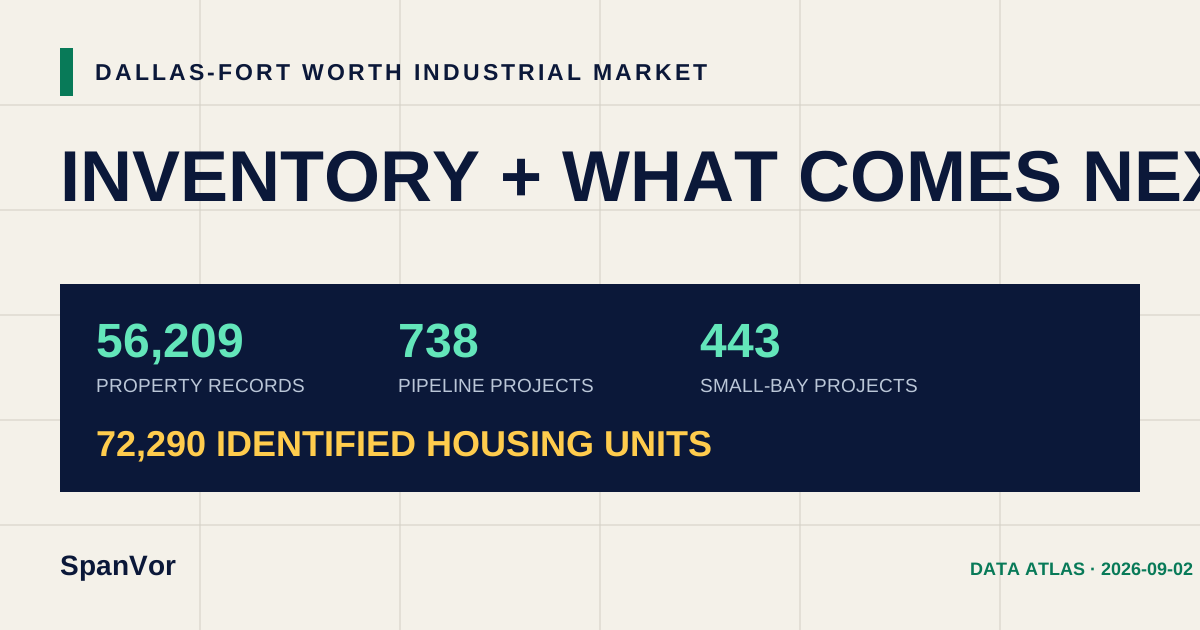
5-county inventory plus separately scoped industrial-development evidence and residential-demand context.
CSV · JSON · Chart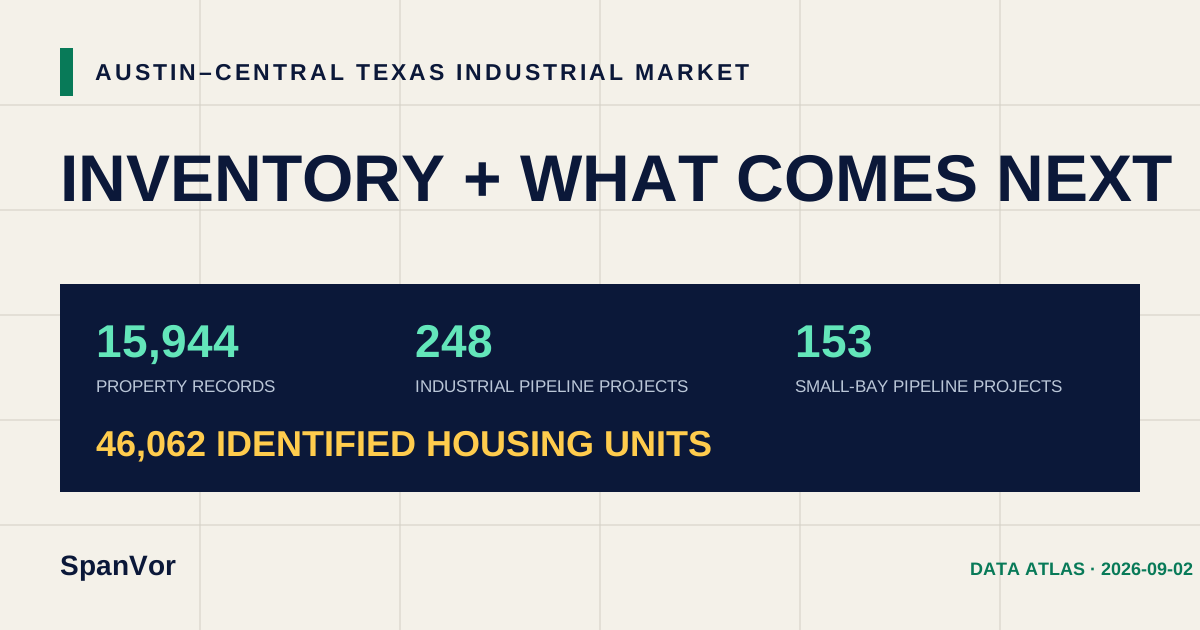
8-county inventory plus separately scoped industrial-development evidence and residential-demand context.
CSV · JSON · Chart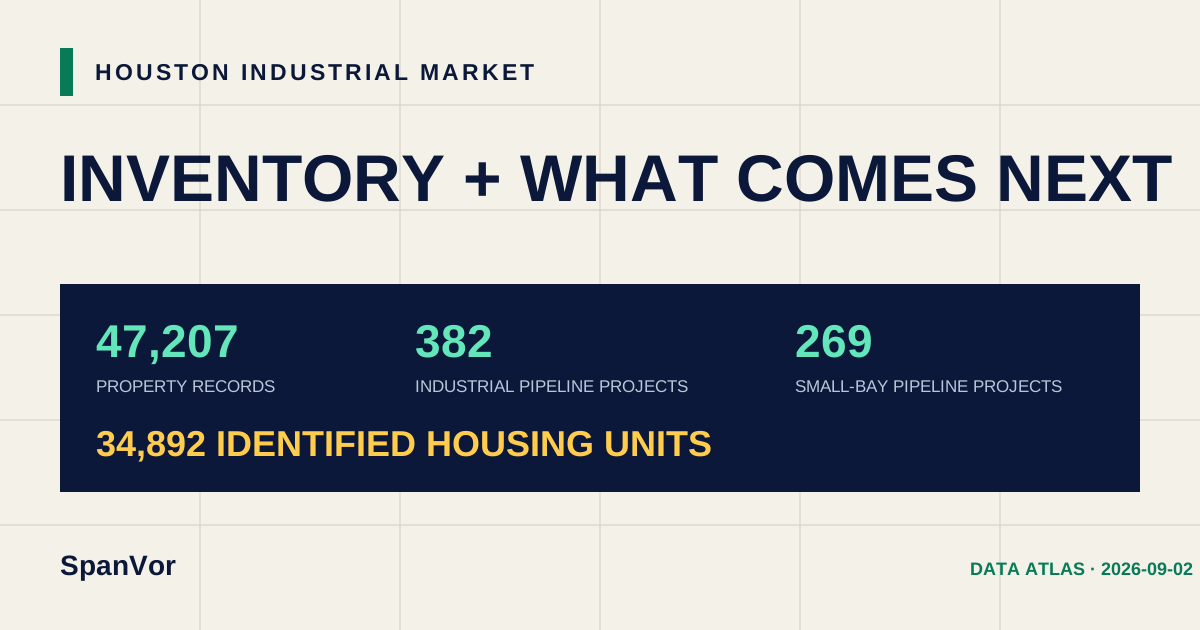
6-county inventory plus separately scoped industrial-development evidence and residential-demand context.
CSV · JSON · Chart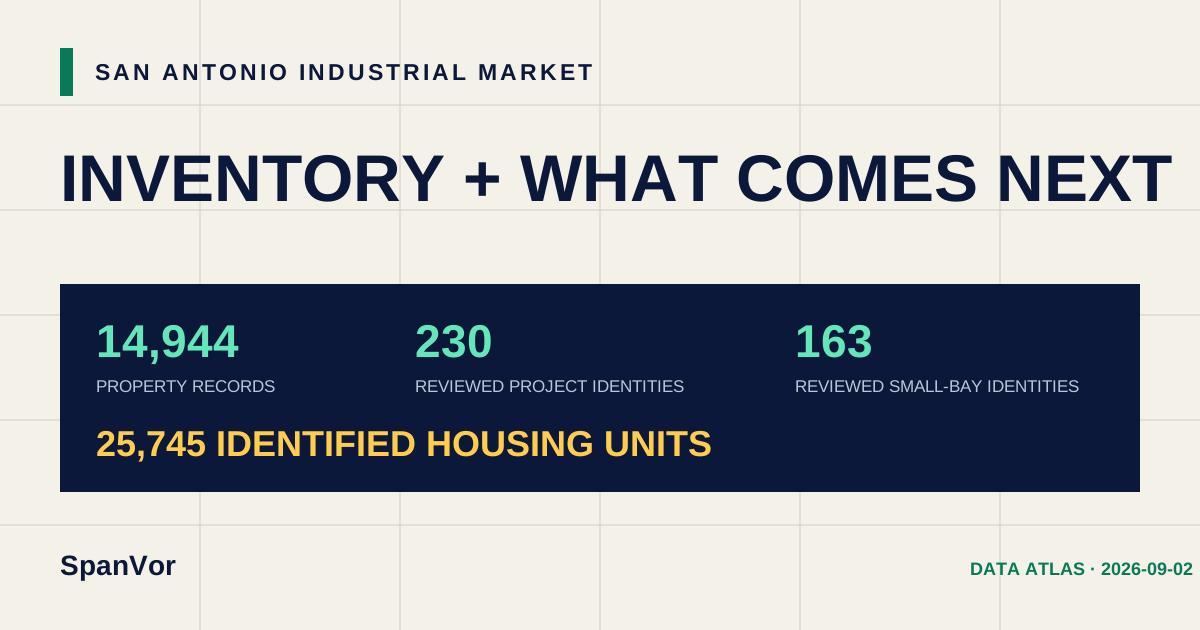
Statewide inventory and exact aggregates for all 67 counties, including small-bay, building-area, tenant, value, and IOS coverage.
CSV · JSON · Chart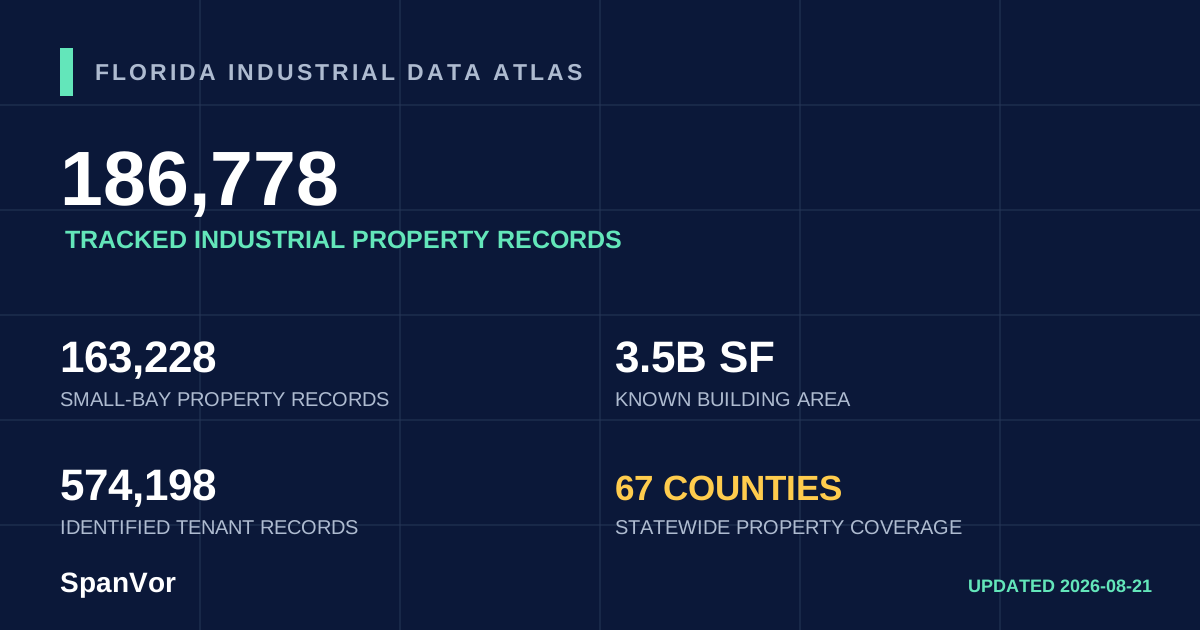
3-county inventory plus separately scoped industrial-development evidence and residential-demand context.
CSV · JSON · Chart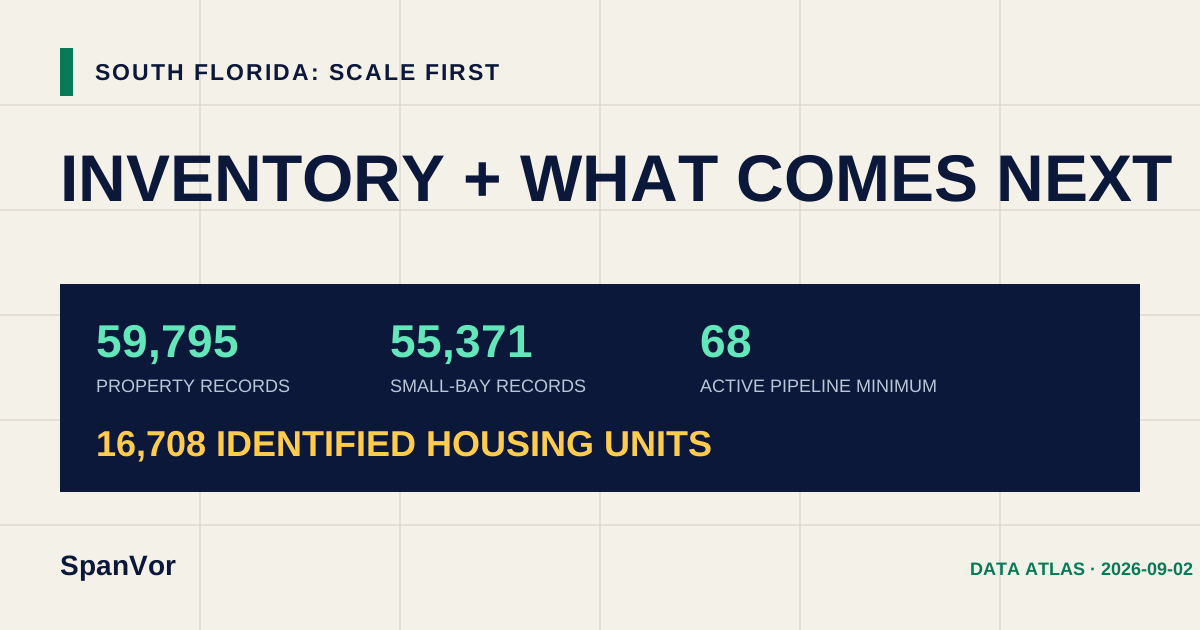
4-county inventory plus separately scoped industrial-development evidence and residential-demand context.
CSV · JSON · Chart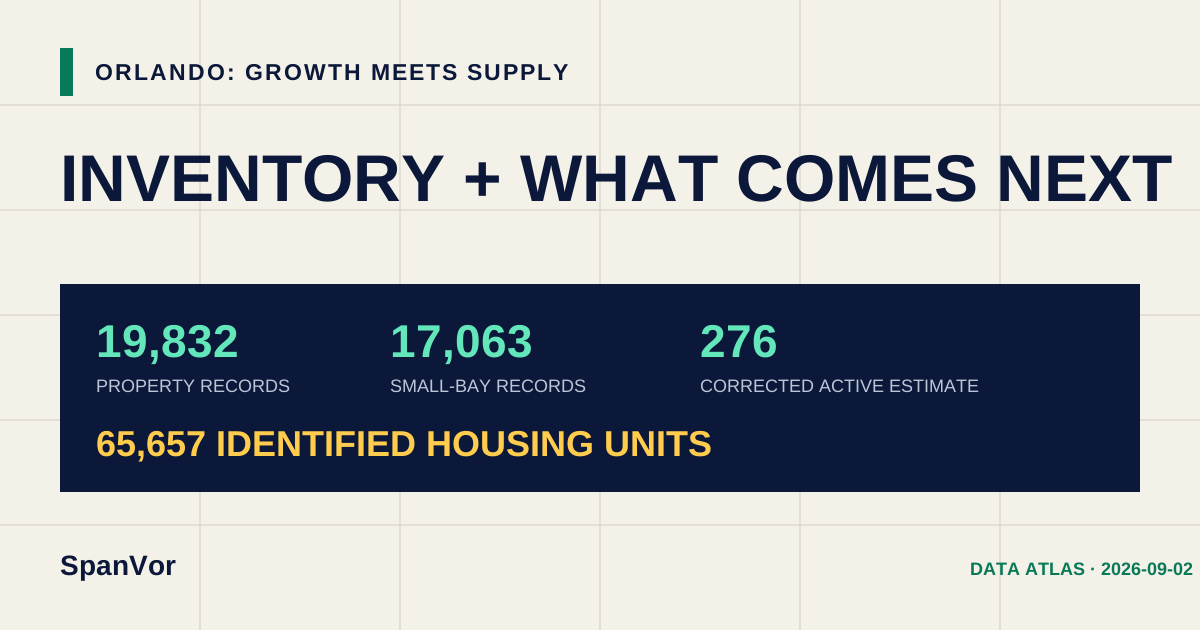
4-county inventory plus separately scoped industrial-development evidence and residential-demand context.
CSV · JSON · Chart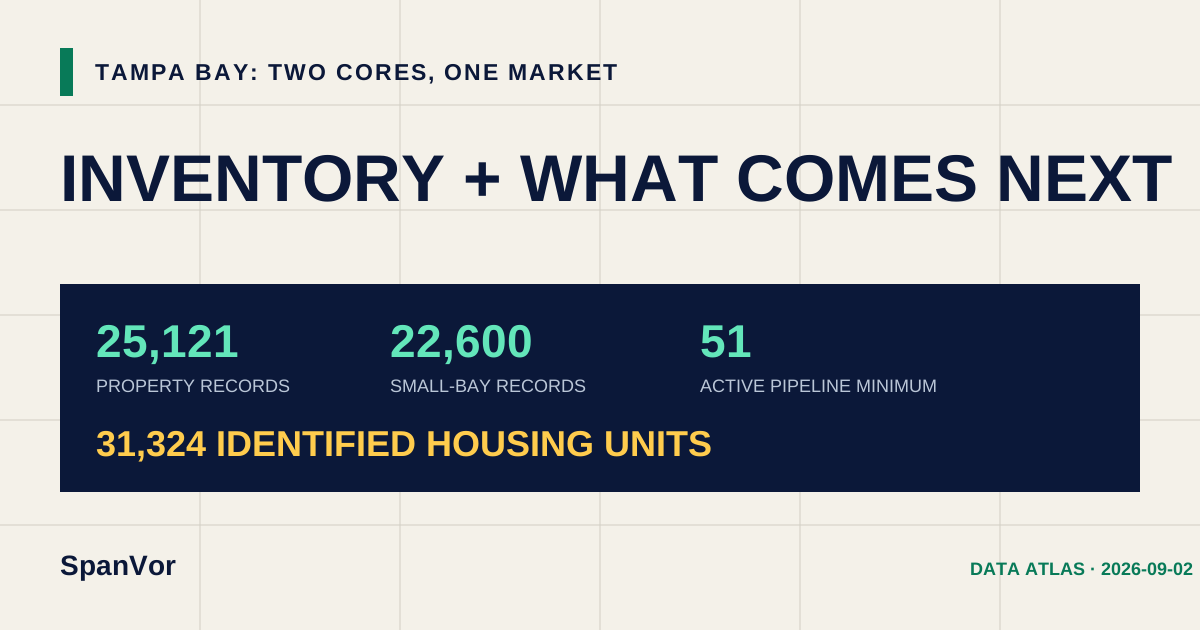
4-county inventory plus separately scoped industrial-development evidence and residential-demand context.
CSV · JSON · Chart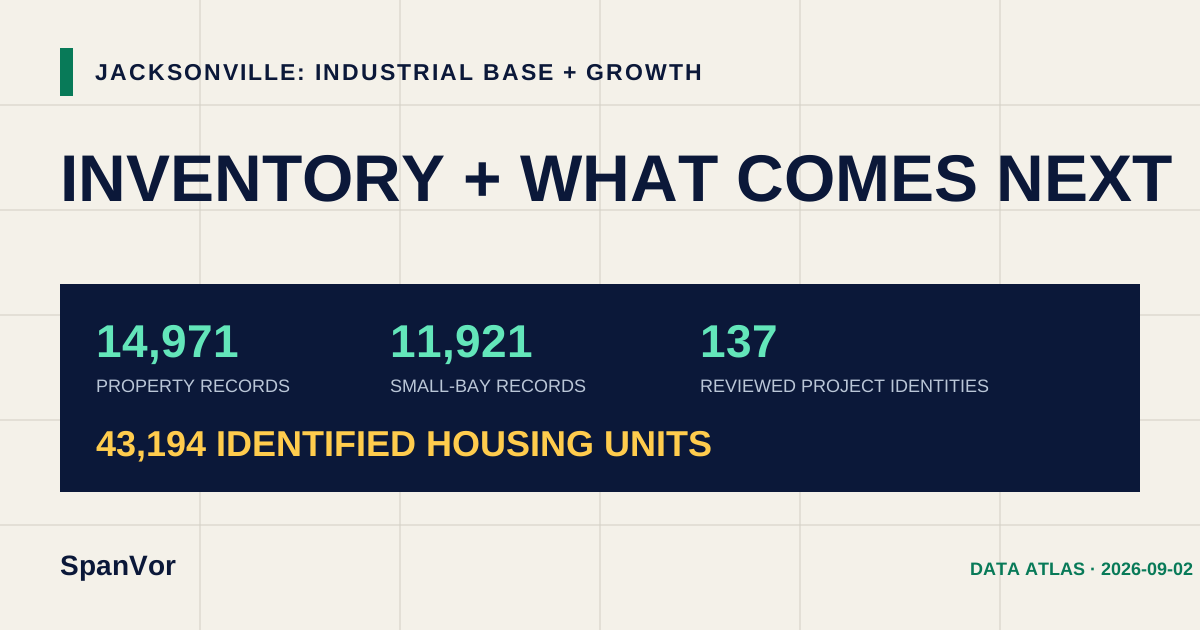
Suggested citations, chart credits, revision policy, and help interpreting a metric.
Open citation guide →Public aggregate license. You may quote and republish these aggregate figures with attribution and a link to the relevant SpanVor data page. Do not imply that the files contain current availability, executed rents, vacancy, ownership contacts, or a complete list of individual projects.