Reviewed project
A physical industrial or small-bay development identity reconciled from one or more connected public records. Repeated filings should not become repeated projects.
SpanVor Industrial Data Atlas / New supply
A measured view of industrial and small-bay projects from reviewed public records. The page distinguishes metro totals from authority-level subsets, keeps existing inventory separate, and leaves unavailable measures unavailable.
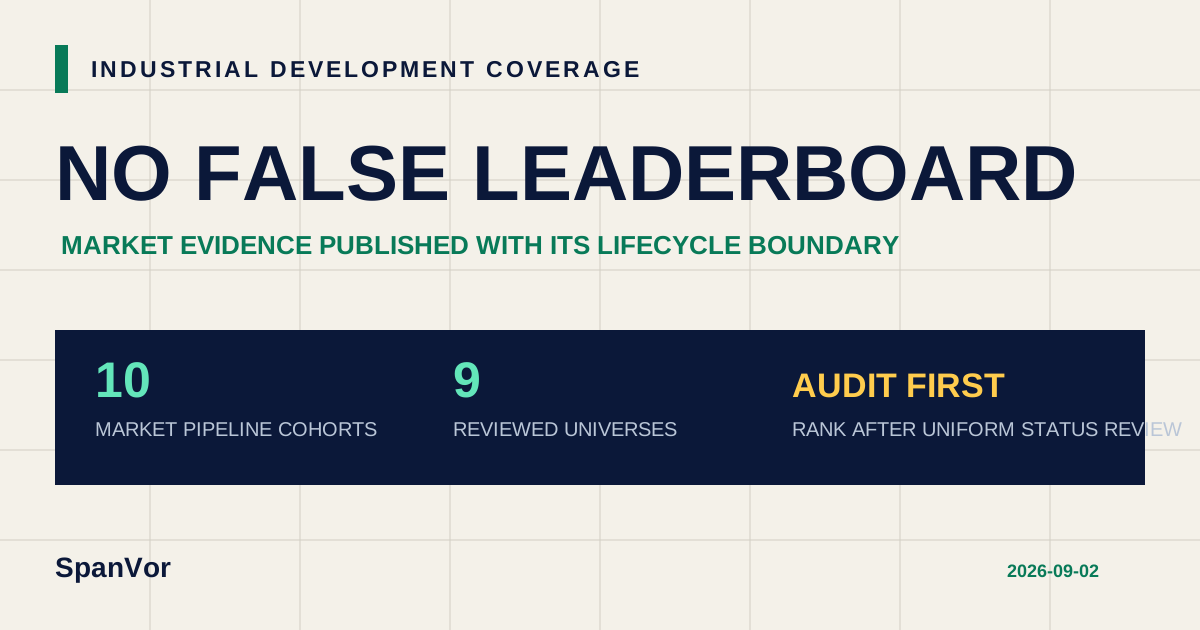
Cross-market ranking is withheld while SpanVor completes a uniform lifecycle audit. The page previously ranked mixed market-contract projects beside broader reviewed identities. That was not a valid like-for-like comparison. The tables now keep market-specific pipeline cohorts and broader project histories separate, publish them alphabetically, and do not add either collection into a national pipeline headline. Another 37 markets publish bounded authority evidence, and 1 market remains candidate-only.
Market-specific pipeline evidence
These cohorts were classified as current or planned under their individual market contracts. Differences in status vocabulary, source windows, and recent-delivery visibility mean they are not yet certified for cross-market ranking.
| Market | Coverage | Identity scope | Projects | Small-bay | Published building SF | Comparison status | As of |
|---|---|---|---|---|---|---|---|
| Atlanta | Measured authority subset | Active pipeline | 300 | 87 | 1,497,382 SFRecovered-project subset | Market-specific lifecycle contract; not certified for cross-market ranking | 2026-08-21 |
| Austin / Central Texas I-35 | Measured authority subset | Active pipeline | 248 | 153 | Not published | Market-specific lifecycle contract; not certified for cross-market ranking | 2026-08-21 |
| Baltimore–Columbia–Towson | Measured authority subset | Active pipeline | 116 | Not published | Not published | Market-specific lifecycle contract; not certified for cross-market ranking | 2026-08-22 |
| Dallas-Fort Worth | Measured authority subset | Active pipeline | 738 | 443 | 25,913,916 SFRecovered-project subset | Market-specific lifecycle contract; not certified for cross-market ranking | 2026-08-20 |
| Houston | Measured authority subset | Active pipeline | 382 | 269 | Not published | Market-specific lifecycle contract; not certified for cross-market ranking | 2026-08-27 |
| Los Angeles | Measured authority subset | Active pipeline | 45 | Not published | Not published | Market-specific lifecycle contract; not certified for cross-market ranking | 2026-08-21 |
| Orlando | Measured authority subset | Active pipeline | 276 | 164 | 4,001,826 SFRecovered-project subset | Market-specific lifecycle contract; not certified for cross-market ranking | 2026-08-21 |
| Phoenix | Measured authority subset | Active pipeline | 359 | 180 | Not published | Market-specific lifecycle contract; not certified for cross-market ranking | 2026-08-21 |
| South Florida / Miami | Measured authority subset | Active pipeline | 68 | Not published | Not published | Market-specific lifecycle contract; not certified for cross-market ranking | 2026-08-21 |
| Tampa Bay | Measured authority subset | Active pipeline | 51 | Not published | Not published | Market-specific lifecycle contract; not certified for cross-market ranking | 2026-08-21 |
Broader reviewed universes
These counts remain valuable for coverage and project-history analysis. They are intentionally unranked because the source windows include different mixtures of historical, recent, inactive, and lifecycle-unknown records.
| Market | Coverage | Reviewed identities | Current evidence | Published building SF | As of |
|---|---|---|---|---|---|
| Baltimore–Columbia–Towson | Measured authority subset | 1,879 | 116 planned or under-development projects; also shown in the active table | 34,551,712 SFMeasured cohort | 2026-08-22 |
| Cape Coral–Fort Myers | Measured authority subset | 1,472 | Lifecycle partition unavailable; not ranked as active pipeline | 9,860,884 SFMeasured cohort | 2026-08-22 |
| Charlotte–Concord–Gastonia | Measured authority subset | 267 | Lifecycle partition unavailable; not ranked as active pipeline | 7,270,828 SFMeasured cohort | 2026-08-22 |
| Jacksonville | Measured authority subset | 137 | Lifecycle partition unavailable; not ranked as active pipeline | Not published | 2026-08-22 |
| Lakeland–Winter Haven | Measured authority subset | 597 | Lifecycle partition unavailable; not ranked as active pipeline | 12,759,446 SFMeasured cohort | 2026-08-22 |
| Minneapolis–St. Paul–Bloomington | Measured authority subset | 327 | 59 projects in the 2025 permit year; construction status is not published | 17,387,004 SFMeasured cohort | 2026-08-24 |
| Nashville–Davidson–Murfreesboro–Franklin | Measured authority subset | 282 | Lifecycle partition unavailable; not ranked as active pipeline | 4,711,267 SFMeasured cohort | 2026-08-22 |
| San Antonio | Measured authority subset | 230 | Recent permit and planning evidence; source does not publish construction or completion status | 495,685 SFMeasured cohort | 2026-09-02 |
| Savannah | Measured authority subset | 43 | Lifecycle partition unavailable; not ranked as active pipeline | Not published | 2026-08-22 |
Every visible market received a second plausibility pass: Phoenix now shows 359 projects after 16 delivered-status records were removed from active supply. Atlanta shows 300 after eight sign, demolition, and no-new-construction records were removed. Orlando shows 276 after eight completed or finaled projects were moved out of active supply. Austin / Central Texas shows 248 after 12 clear retail, restaurant, school, amenity, utility, and supporting-work records were removed. In each case, only rows proven to be net-new versus the preserved earlier review were subtracted.
DFW publishes a 738-project active minimum while a later 136-project net increment is adjudicated. Houston publishes a measured minimum of 382 explicitly current City ILMS projects, with 1,329 older mixed-lifecycle records held outside active supply. Los Angeles, Miami, and Tampa retain measured minimums while later recovery identities are reworked. San Antonio retains a reviewed permit/planning universe but no active total because its principal City source has no construction or completion status. Baltimore contains 1,879 reviewed identities, but only 116 are classified as planned or under development. Cape Coral–Fort Myers and Minneapolis remain reviewed-universe or recent-permit evidence, not active-pipeline totals.
How to read the pipeline
A 10,000-square-foot flex building and a million-square-foot distribution center are both one project. Use the count to understand activity, then use known area, lifecycle, geography, and product type to understand competitive supply.
A physical industrial or small-bay development identity reconciled from one or more connected public records. Repeated filings should not become repeated projects.
Projects classified as under development or planned under the applicable market contract. Recently completed and terminal records stay separate.
Only source-stated building area is counted. A project without published square footage remains in the project count and outside the square-foot total.
Download and cite
Every archive carries its release date and coverage label. That makes a comparison reproducible even after SpanVor publishes a newer pipeline view.
Market-level reviewed aggregate.
No exact project address, party, permit-history, or source-document intelligence is included.
SpanVor. “U.S. Industrial Development Pipeline.” SpanVor Industrial Data Atlas, data through 2026-09-02; lifecycle presentation corrected 2026-09-02. https://spanvor.com/industrial-development-pipeline
Compare the development pipeline with the industrial property universe already on the ground.
Open inventory data →Local contextExplore 60 market profilesMove from the national count into metro Supply, Demand, and existing inventory.
Browse markets →Metric contractIndustrial data glossarySee why project, lead, planned, current, and known square feet are not interchangeable.
Read definitions →