Harris County is a market unto itself
More than 42,500 tracked property records and 213,000 tenant observations sit inside the county.
SpanVor Industrial Data Atlas / Houston
Houston combines port logistics, manufacturing, distribution, service businesses and neighborhood-scale small-bay space in one sprawling market. The useful view starts with Harris County’s extraordinary scale, then separates the coastal, northern and western edges that serve very different users.
What stands out
Harris County contains about nine in ten tracked market records and more than 1.7 billion square feet of known building area. Galveston, Montgomery, Fort Bend and Chambers are much smaller by count, but they reveal where the market shifts from dense local-service inventory toward port, growth-corridor and large-site industrial uses.
More than 42,500 tracked property records and 213,000 tenant observations sit inside the county.
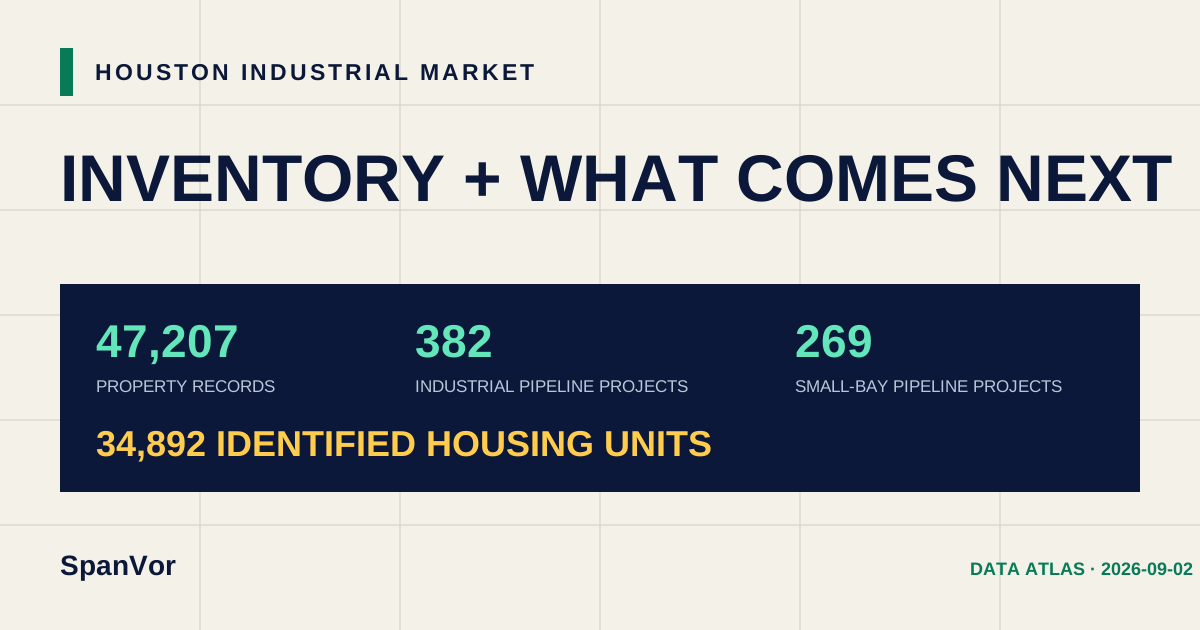
The current reviewed cohort contains 382 industrial projects, including 269 confirmed or probable small-bay projects.
Another 1,329 older project identities remain outside the active total until their work scope and lifecycle can be reconciled.
County inventory
Property records are not one-for-one buildings or available suites. Building area and tenant observations help reveal the operating scale behind each county count.
| Rank | County | Property records | Small-bay records | Known building SF | Tenant records |
|---|---|---|---|---|---|
| 1 | HarrisFIPS 48201 | 42,579 | 32,853 | 1.8B | 213,282 |
| 2 | GalvestonFIPS 48167 | 1,828 | 1,654 | 47.3M | 5,126 |
| 3 | MontgomeryFIPS 48339 | 966 | 773 | 23.9M | 1,562 |
| 4 | ChambersFIPS 48071 | 855 | 174 | 18.2M | 12 |
| 5 | Fort BendFIPS 48157 | 476 | 341 | 23.3M | 516 |
| 6 | WallerFIPS 48473 | 255 | 87 | 7.1M | 66 |
| 7 | BrazoriaFIPS 48039 | 194 | 62 | 5.4M | 25 |
| 8 | LibertyFIPS 48291 | 54 | 30 | 1.2M | 10 |
What comes next
Measured minimum from the City of Houston ILMS cohort with an explicit lifecycle split. The 1,329 records in two older Houston cohorts are retained as audit-pending evidence and are not represented as active pipeline until their work scope and lifecycle are reconciled.
Known active building area: about 13M square feet is source-stated for the published active cohort. Projects without usable square footage remain in the project count but outside this area total.
Held outside the active total: 1,329 additional project identities remain available for audit rather than being quietly promoted into the headline.
Inventory coverage
37,298 of 47,207 records carry usable building area, or 79.0%. Tenant observations cover 33,632 property records.
Review the current public industrial-development lens.
Open Supply →Growth contextHouston DemandFollow housing and other local development signals.
Open Demand →State comparisonTexas industrial dataPlace this market inside the statewide property and county picture.
Open Texas →Download and cite
The files keep existing inventory, industrial development evidence and residential demand context in separate rows with their own dates and labels.
Houston public aggregate.
Exact project records, addresses, ownership, contacts and source documents remain outside the public file.
SpanVor. “Houston Industrial Market.” SpanVor Industrial Data Atlas, inventory through 2026-08-21; development evidence through 2026-08-27; housing evidence through 2026-09-02. https://spanvor.com/markets/houston