Building-area coverage
113,555 records carry usable building area.
SpanVor Industrial Data Atlas / Texas
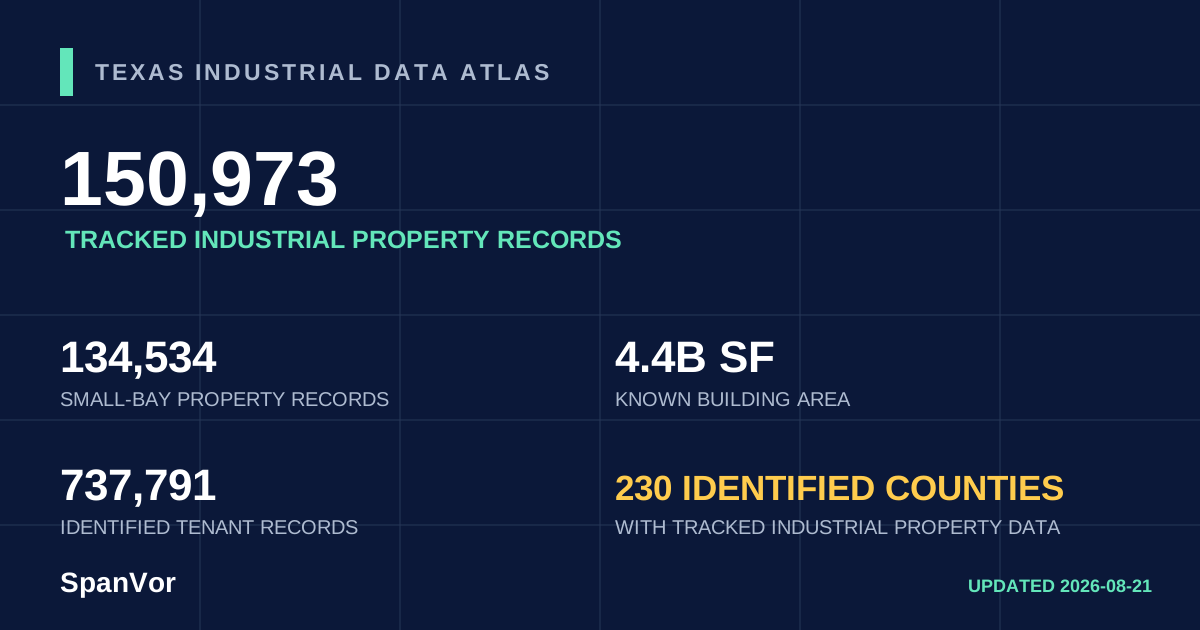
Texas is not one industrial market. This statewide view puts the property base, small-bay universe, known building area and tenant observations in one citable place—then lets readers see how the major metros and counties differ.
Four market lenses
Market inventory uses fixed metro counties. Development counts retain each market’s own reviewed lifecycle boundary, so this table does not pretend every city reports permits the same way.
| # | Market | Property records | Small-bay records | Known building SF | Development evidence | Housing pipeline |
|---|---|---|---|---|---|---|
| 1 | Dallas-Fort WorthInventory through 2026-08-21 | 56,209 | 54,326 | 1.4B | 738market-specific pipeline minimum | 72,290identified units |
| 2 | HoustonInventory through 2026-08-21 | 47,207 | 35,974 | 1.9B | 382market-specific pipeline minimum | 34,892identified units |
| 3 | Austin–Central TexasInventory through 2026-08-21 | 15,944 | 15,647 | 356.2M | 248market-specific pipeline minimum | 46,062identified units |
| 4 | San AntonioInventory through 2026-08-21 | 14,944 | 14,651 | 335.8M | 230reviewed universe; active total withheld | 25,745identified units |
Do not add these market figures into a statewide development total. Inventory uses one stable county-aggregate definition. Development sources, status vocabularies and coverage windows differ by authority, so the figures remain market-specific until a uniform lifecycle audit is complete.
Largest county aggregates
These are property-record counts, not building counts or current availability. Separately assessed units, sites and parcels can affect how a county’s record total compares with the physical skyline.
| Rank | County | Property records | Small-bay records | Known building SF | Tenant records | IOS candidates |
|---|---|---|---|---|---|---|
| 1 | HarrisFIPS 48201 | 42,579 | 32,853 | 1.8B | 213,282 | 4,319 |
| 2 | TarrantFIPS 48439 | 24,203 | 23,500 | 554.8M | 150,588 | 3,334 |
| 3 | BexarFIPS 48029 | 13,656 | 13,483 | 298.1M | 89,422 | 1,996 |
| 4 | DallasFIPS 48113 | 12,001 | 11,561 | 422.4M | 94,598 | 1,738 |
| 5 | DentonFIPS 48121 | 11,059 | 10,930 | 173.5M | 24,358 | 426 |
| 6 | TravisFIPS 48453 | 10,819 | 10,721 | 173M | 66,417 | 282 |
| 7 | CollinFIPS 48085 | 7,116 | 6,746 | 178.1M | 33,494 | 633 |
| 8 | NuecesFIPS 48355 | 4,226 | 4,158 | 127.5M | 10,503 | 169 |
| 9 | WilliamsonFIPS 48491 | 3,544 | 3,446 | 137M | 20,094 | 270 |
| 10 | McLennanFIPS 48309 | 3,158 | 2,994 | 56.2M | 3,313 | 15 |
| 11 | BellFIPS 48027 | 2,164 | 2,134 | 59.2M | 2,053 | 0 |
| 12 | JeffersonFIPS 48245 | 2,008 | 1,995 | 48.9M | 4,511 | 138 |
| 13 | GalvestonFIPS 48167 | 1,828 | 1,654 | 47.3M | 5,126 | 116 |
| 14 | HaysFIPS 48209 | 1,466 | 1,436 | 45.4M | 9,196 | 111 |
| 15 | EllisFIPS 48139 | 1,464 | 1,392 | 50.2M | 3,735 | 158 |
Coverage before conclusions
The denominator is the 150,973 tracked Texas property records. A missing field remains missing; it is never converted to zero.
113,555 records carry usable building area.
104,153 records carry assessed value. Assessed value is not market value.
112,432 records have at least one identified tenant observation.
Download and cite
The page uses rounded language where it helps the reader. The files retain exact values for every represented county.
Statewide aggregate by county.
No property addresses, tenant names, owner records, contacts, coordinates or permit identities are included.
SpanVor. “Texas Industrial Property Statistics.” SpanVor Industrial Data Atlas, inventory data through 2026-08-21. https://spanvor.com/states/texas