Bexar defines today’s market
More than 13,600 tracked property records and about 298 million square feet of known building area sit in Bexar County.
SpanVor Industrial Data Atlas / San Antonio
San Antonio’s industrial base remains heavily concentrated in Bexar County, while Guadalupe and Comal form a smaller but important extension toward the Austin corridor. This six-county profile shows the physical market clearly—and refuses to label a permit record as active construction when the source does not prove it.
What stands out
Bexar County supplies the overwhelming majority of tracked properties and known building area. Guadalupe is the clearest secondary industrial base, while Comal is smaller in the current inventory but sits directly in the path of regional population and business growth.
More than 13,600 tracked property records and about 298 million square feet of known building area sit in Bexar County.
The county contributes 956 tracked records and about 28 million square feet of known building area.
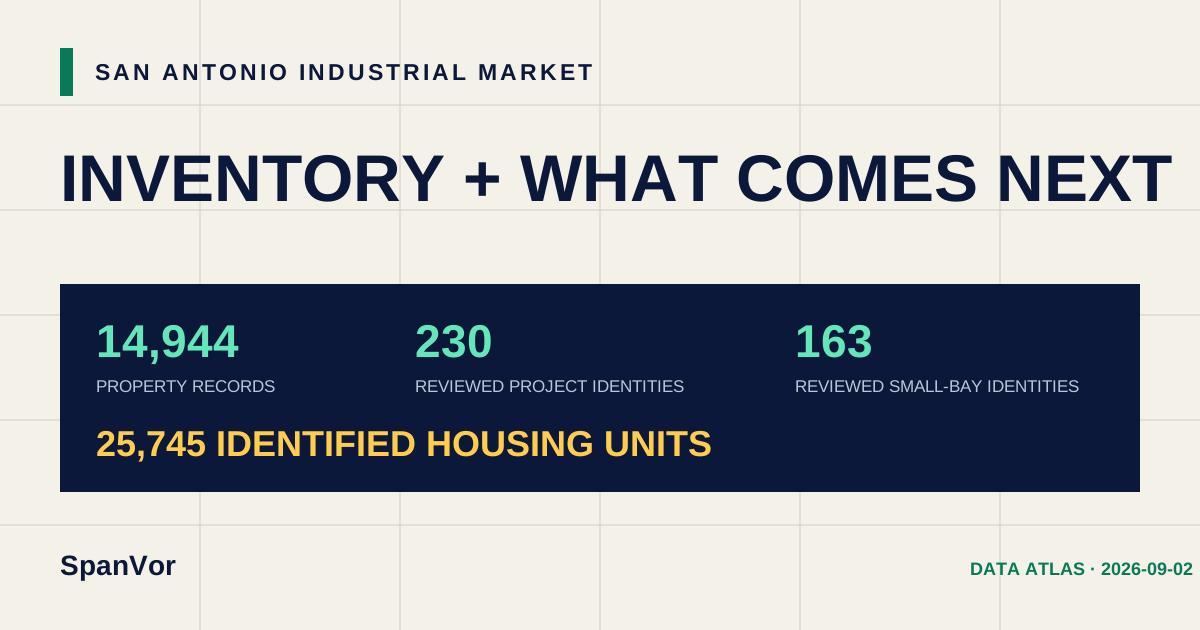
SpanVor can show 230 reviewed recent permit and planning identities, but the principal source cannot support a defensible active-pipeline total.
County inventory
Property records are not one-for-one buildings or available suites. Building area and tenant observations help reveal the operating scale behind each county count.
| Rank | County | Property records | Small-bay records | Known building SF | Tenant records |
|---|---|---|---|---|---|
| 1 | BexarFIPS 48029 | 13,656 | 13,483 | 298.1M | 89,422 |
| 2 | GuadalupeFIPS 48187 | 956 | 939 | 28.2M | 2,624 |
| 3 | ComalFIPS 48091 | 191 | 176 | 8.3M | 62 |
| 4 | AtascosaFIPS 48013 | 88 | 15 | 277.7K | 5 |
| 5 | WilsonFIPS 48493 | 33 | 20 | 311.8K | 4 |
| 6 | KendallFIPS 48259 | 20 | 18 | 630.9K | 12 |
What comes next
Active industrial pipeline is withheld because the principal City of San Antonio permit sources publish application and issue dates but no construction, completion, or occupancy status. The 230 reviewed permit/planning identities and 163 small-bay classifications remain visible as a nonadditive recent-project universe.
Reviewed project-area evidence: about 495.7K square feet is stated within the recent reviewed subset. It is not represented as active pipeline square footage.
Inventory coverage
10,891 of 14,944 records carry usable building area, or 72.9%. Tenant observations cover 13,840 property records.
Review the current public industrial-development lens.
Open Supply →Growth contextSan Antonio DemandFollow housing and other local development signals.
Open Demand →State comparisonTexas industrial dataPlace this market inside the statewide property and county picture.
Open Texas →Download and cite
The files keep existing inventory, industrial development evidence and residential demand context in separate rows with their own dates and labels.
San Antonio public aggregate.
Exact project records, addresses, ownership, contacts and source documents remain outside the public file.
SpanVor. “San Antonio Industrial Market.” SpanVor Industrial Data Atlas, inventory through 2026-08-21; development evidence through 2026-08-21; housing evidence through 2026-09-02. https://spanvor.com/markets/san-antonio