Miami-Dade sets the scale
Miami-Dade holds more than three-fifths of the market’s tracked property records and over 226,000 tenant observations.
SpanVor Industrial Data Atlas / South Florida
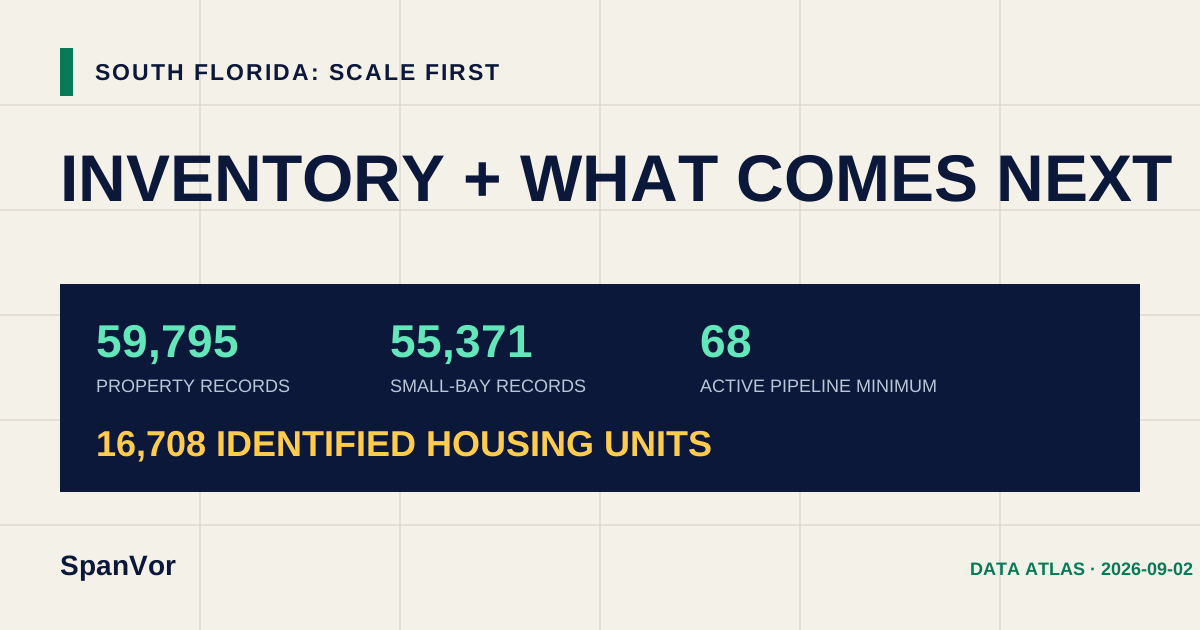
South Florida’s industrial story is not captured by a handful of large warehouses. Nearly 60,000 tracked property records stretch from Miami-Dade through Broward and Palm Beach, with an unusually deep base of small-bay properties and business locations.
What stands out
Miami-Dade supplies the scale. Broward supplies a remarkably concentrated small-bay base. Palm Beach adds a different mix of property size and value. Together they form one labor and business corridor—but not one interchangeable pricing or supply pocket.
Miami-Dade holds more than three-fifths of the market’s tracked property records and over 226,000 tenant observations.
More than nine in ten tracked market records sit in SpanVor’s small-bay universe. That is an inventory lens, not a vacancy claim.
The active pipeline headline stays at a conservative minimum because later permit identities do not yet carry a reliable, uniform delivery status.
County inventory
Property records are not one-for-one buildings or available suites. Building area and tenant observations help reveal the operating scale behind each county count.
| Rank | County | Property records | Small-bay records | Known building SF | Tenant records |
|---|---|---|---|---|---|
| 1 | Miami-DadeFIPS 12086 | 38,338 | 36,742 | 592.9M | 226,448 |
| 2 | Palm BeachFIPS 12099 | 12,076 | 9,612 | 165.9M | 60,061 |
| 3 | BrowardFIPS 12011 | 9,381 | 9,017 | 158.2M | 29,166 |
What comes next
Measured active minimum of 68 previously reviewed current/planned projects. The later 175-identity recovery cohort remains useful, nonadditive project evidence but is held outside active supply pending a uniform lifecycle and physical-project identity review.
Held outside the active total: 175 later identities remain available for audit rather than being quietly added to the headline.
Inventory coverage
51,670 of 59,795 records carry usable building area, or 86.4%. Tenant observations cover 34,062 property records.
Review the current public industrial-development lens.
Open Supply →Growth contextSouth Florida DemandFollow housing and other local development signals.
Open Demand →State comparisonFlorida industrial dataPlace this market inside the complete 67-county property picture.
Open Florida →Download and cite
The files keep existing inventory, industrial development evidence and residential demand context in separate rows with their own dates and labels.
South Florida public aggregate.
Exact project records, addresses, ownership, contacts and source documents remain outside the public file.
SpanVor. “Miami–Fort Lauderdale–West Palm Beach Industrial Market.” SpanVor Industrial Data Atlas, inventory through 2026-08-21; development evidence through 2026-08-21; housing evidence through 2026-09-02. https://spanvor.com/markets/miami