Miami-Dade property records
The state’s largest county inventory also carries 226,448 identified tenant observations.
SpanVor Industrial Data Atlas / Florida
South Florida, Tampa Bay, Orlando, Jacksonville and Southwest Florida do not behave like one interchangeable market. This statewide view starts with the full 67-county property base, then shows where inventory, small-bay space and business activity actually concentrate.
What jumps off the page
Miami-Dade has the largest tracked property base. Orange, Duval and Hillsborough carry substantially more known building area than some counties with similar record counts. That difference matters when the question is small-business space versus large-format industrial capacity.
The state’s largest county inventory also carries 226,448 identified tenant observations.
Lee ranks second by record count, an important reminder that Florida industrial is not only a four-metro story.
Jacksonville’s core county carries one of Florida’s deepest known industrial building-area concentrations.
Four deeper market lenses
Inventory is comparable because each market uses a fixed county definition. Development evidence keeps its own lifecycle label, so a reviewed permit universe is never presented as equal to an active pipeline.
| Market | Property records | Small-bay records | Known building SF | Development evidence | Housing pipeline |
|---|---|---|---|---|---|
| South FloridaMiami–Fort Lauderdale–West Palm Beach | 59,795 | 55,371 | 917M | 68active market minimum | 16,708identified units |
| OrlandoOrlando–Kissimmee–Sanford | 19,832 | 17,063 | 483.8M | 276corrected active estimate | 65,657identified units |
| Tampa BayTampa–St. Petersburg–Clearwater | 25,121 | 22,600 | 658.5M | 51active market minimum | 31,324identified units |
| JacksonvilleJacksonville | 14,971 | 11,921 | 453.6M | 137reviewed identities; active total unavailable | 43,194identified units |
No statewide pipeline total is shown. Miami and Tampa publish conservative active minimums, Orlando publishes a corrected active estimate, and Jacksonville publishes a reviewed project universe whose active lifecycle split is unavailable. Adding those numbers would create a total that looks cleaner than the evidence.
Largest county aggregates
These are property-record counts, not one-for-one buildings, vacancies or available suites. The building-area and tenant columns provide the context a simple property count cannot.
| Rank | County | Property records | Small-bay records | Known building SF | Tenant records | IOS candidates |
|---|---|---|---|---|---|---|
| 1 | Miami-DadeFIPS 12086 | 38,338 | 36,742 | 592.9M | 226,448 | 4,806 |
| 2 | LeeFIPS 12071 | 13,379 | 12,307 | 158.2M | 33,199 | 706 |
| 3 | OrangeFIPS 12095 | 13,268 | 11,766 | 370.4M | 48,130 | 1,148 |
| 4 | DuvalFIPS 12031 | 13,214 | 10,899 | 424.9M | 18,043 | 956 |
| 5 | Palm BeachFIPS 12099 | 12,076 | 9,612 | 165.9M | 60,061 | 1,104 |
| 6 | PinellasFIPS 12103 | 11,828 | 10,588 | 210.4M | 32,517 | 976 |
| 7 | HillsboroughFIPS 12057 | 10,795 | 9,840 | 405.4M | 28,037 | 1,006 |
| 8 | BrowardFIPS 12011 | 9,381 | 9,017 | 158.2M | 29,166 | 266 |
| 9 | VolusiaFIPS 12127 | 5,870 | 4,387 | 69M | 6,081 | 264 |
| 10 | SarasotaFIPS 12115 | 5,491 | 4,808 | 38.1M | 18,917 | 463 |
| 11 | AlachuaFIPS 12001 | 4,442 | 4,006 | 45.9M | 3,704 | 98 |
| 12 | MonroeFIPS 12087 | 3,787 | 2,535 | 102M | 1,297 | 3 |
| 13 | PolkFIPS 12105 | 3,782 | 2,587 | 99.2M | 4,511 | 178 |
| 14 | SeminoleFIPS 12117 | 3,750 | 3,011 | 63.7M | 8,585 | 278 |
| 15 | HighlandsFIPS 12055 | 3,075 | 2,299 | 22M | 612 | 2 |
Coverage before conclusions
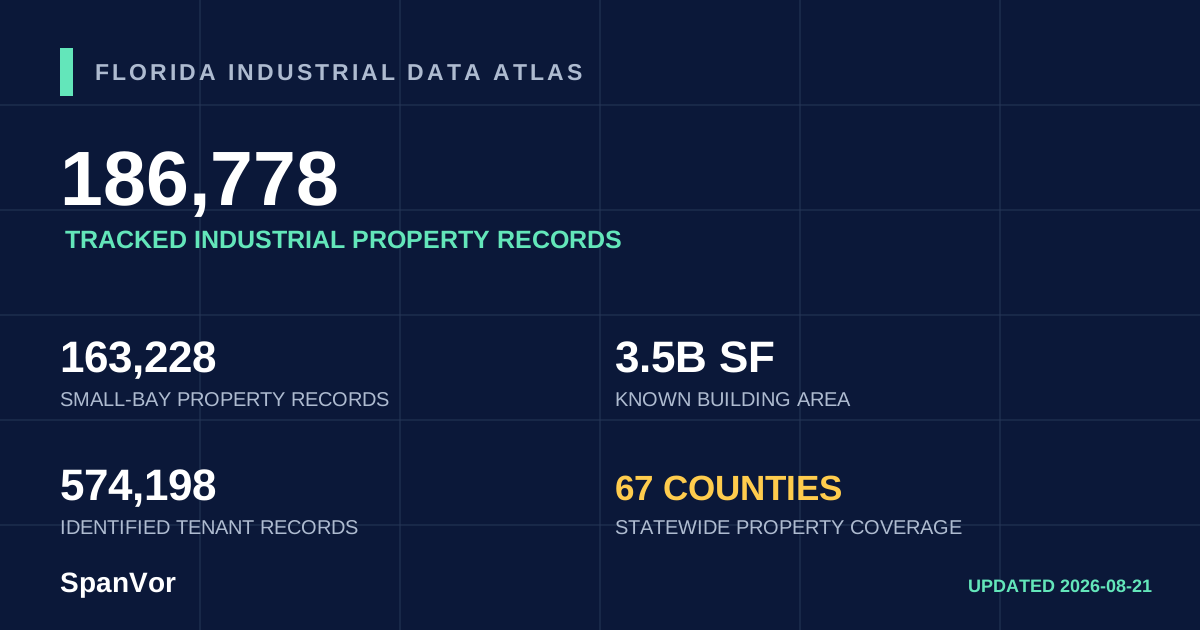
The denominator is all 186,778 tracked Florida property records. Missing fields remain missing rather than becoming zeros.
150,017 records carry usable building area.
174,082 records carry assessed value. Assessed value is not market value.
81,757 records have at least one identified tenant observation.
Download and cite
The narrative rounds where useful. The downloadable files retain exact values for every Florida county.
Statewide aggregate by county.
No property addresses, tenant names, owner records, contacts, coordinates or permit identities are included.
SpanVor. “Florida Industrial Property Statistics.” SpanVor Industrial Data Atlas, inventory data through 2026-08-21. https://spanvor.com/states/florida