Housing is the loudest demand signal
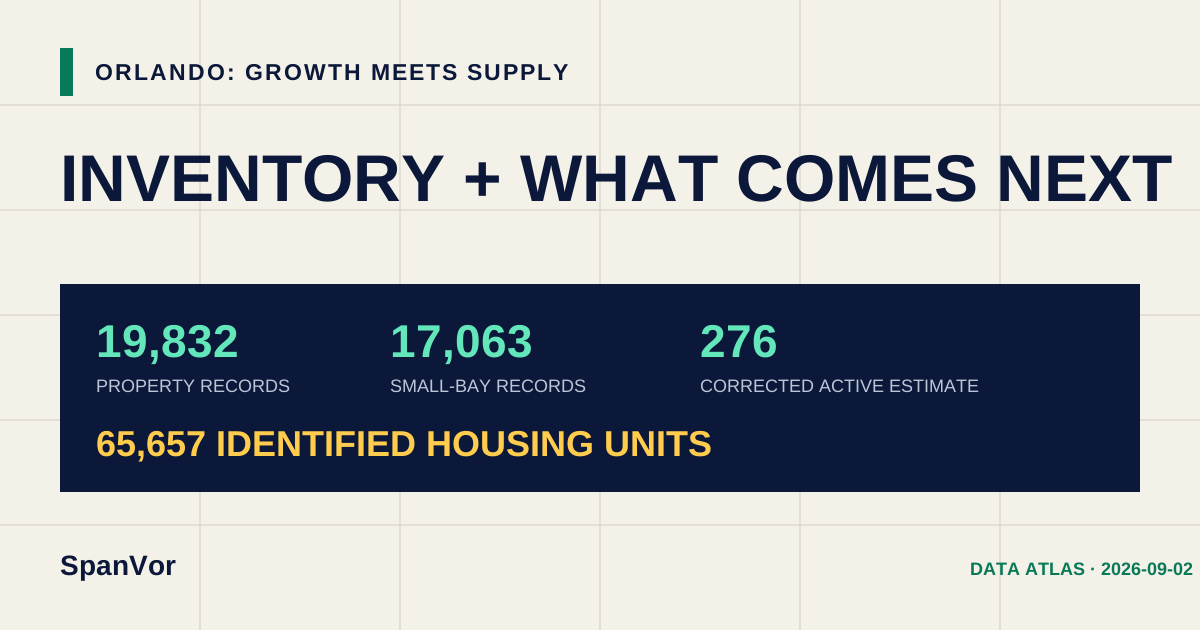
About 65,700 identified current and planned units create a broad future customer and labor base for local operators.
SpanVor Industrial Data Atlas / Orlando
Orlando is a distribution market, a service-business market and a population-growth market at the same time. The useful question is not simply how much industrial exists, but whether the next wave of product matches the businesses and neighborhoods being added around it.
What stands out
Orange County carries the market’s largest property and building-area base. Seminole, Osceola and Lake extend the operating map in different directions, while the identified housing pipeline is larger than in the other Florida Atlas markets.
About 65,700 identified current and planned units create a broad future customer and labor base for local operators.
164 of the 276-project corrected active estimate fall inside the confirmed or probable small-bay universe.
Orange holds roughly two-thirds of the market’s tracked properties and more than three-quarters of its known building area.
County inventory
Property records are not one-for-one buildings or available suites. Building area and tenant observations help reveal the operating scale behind each county count.
| Rank | County | Property records | Small-bay records | Known building SF | Tenant records |
|---|---|---|---|---|---|
| 1 | OrangeFIPS 12095 | 13,268 | 11,766 | 370.4M | 48,130 |
| 2 | SeminoleFIPS 12117 | 3,750 | 3,011 | 63.7M | 8,585 |
| 3 | LakeFIPS 12069 | 1,675 | 1,240 | 19.1M | 1,999 |
| 4 | OsceolaFIPS 12097 | 1,139 | 1,046 | 30.7M | 4,150 |
What comes next
The corrected measured estimate excludes 8 exact net-new rows whose source lifecycle or work scope contradicts active new industrial supply. The evidence is preserved as nonadditive audit history.
Inventory coverage
16,175 of 19,832 records carry usable building area, or 81.6%. Tenant observations cover 9,511 property records.
Review the current public industrial-development lens.
Open Supply →Growth contextOrlando DemandFollow housing and other local development signals.
Open Demand →State comparisonFlorida industrial dataPlace this market inside the complete 67-county property picture.
Open Florida →Download and cite
The files keep existing inventory, industrial development evidence and residential demand context in separate rows with their own dates and labels.
Orlando public aggregate.
Exact project records, addresses, ownership, contacts and source documents remain outside the public file.
SpanVor. “Orlando–Kissimmee–Sanford Industrial Market.” SpanVor Industrial Data Atlas, inventory through 2026-08-21; development evidence through 2026-08-21; housing evidence through 2026-09-02. https://spanvor.com/markets/orlando