Pinellas leads in property count
Its dense, mature industrial fabric produces the market’s largest tracked property base and more than 10,500 small-bay records.
SpanVor Industrial Data Atlas / Tampa Bay
Tampa Bay’s industrial map is not a simple downtown-to-suburb gradient. Pinellas carries the largest property count, Hillsborough carries far more known building area, and Pasco and Hernando extend the growth edge northward.
What stands out
Pinellas and Hillsborough together contain almost nine in ten tracked market records, yet they represent different physical products and operating environments. That distinction is more useful than treating Tampa Bay as one average industrial location.
Its dense, mature industrial fabric produces the market’s largest tracked property base and more than 10,500 small-bay records.
Known industrial building area in Hillsborough is nearly twice Pinellas, showing why count and square footage answer different questions.
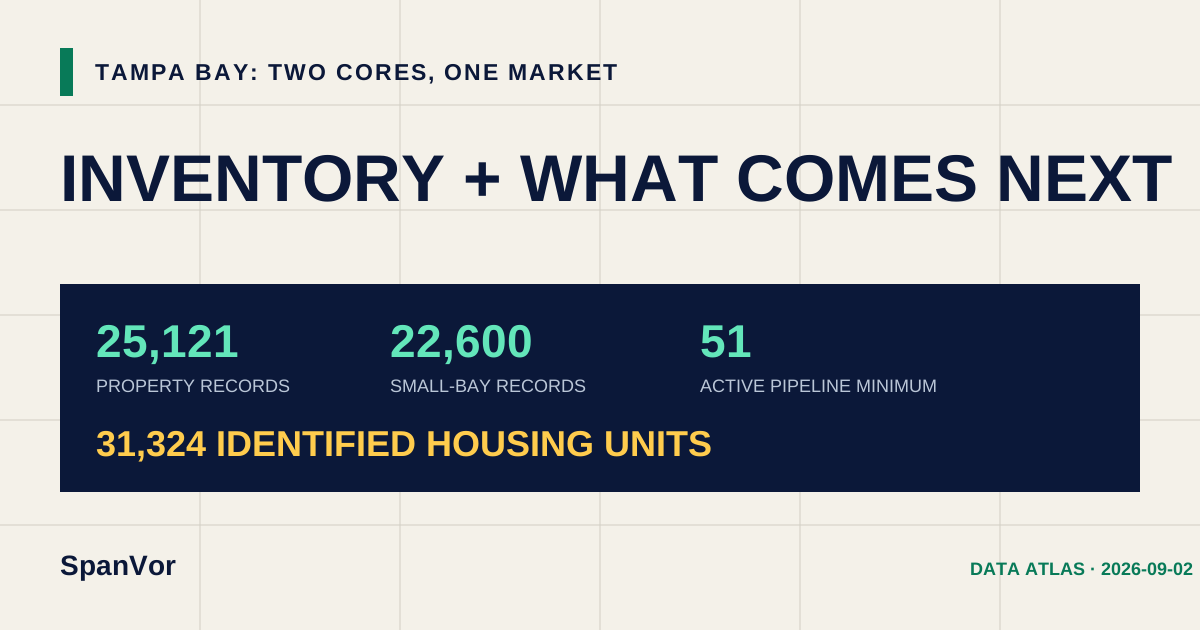
More than 31,000 identified current and planned housing units add demand context, especially where Pasco and Hernando connect to the core.
County inventory
Property records are not one-for-one buildings or available suites. Building area and tenant observations help reveal the operating scale behind each county count.
| Rank | County | Property records | Small-bay records | Known building SF | Tenant records |
|---|---|---|---|---|---|
| 1 | PinellasFIPS 12103 | 11,828 | 10,588 | 210.4M | 32,517 |
| 2 | HillsboroughFIPS 12057 | 10,795 | 9,840 | 405.4M | 28,037 |
| 3 | PascoFIPS 12101 | 2,105 | 1,825 | 34.2M | 4,203 |
| 4 | HernandoFIPS 12053 | 393 | 347 | 8.6M | 708 |
What comes next
Measured active minimum of 51 previously reviewed current/planned projects. The later 115-identity recovery cohort remains useful, nonadditive project evidence but is held outside active supply pending a uniform lifecycle and physical-project identity review.
Held outside the active total: 115 later identities remain available for audit rather than being quietly added to the headline.
Inventory coverage
21,734 of 25,121 records carry usable building area, or 86.5%. Tenant observations cover 13,306 property records.
Review the current public industrial-development lens.
Open Supply →Growth contextTampa Bay DemandFollow housing and other local development signals.
Open Demand →State comparisonFlorida industrial dataPlace this market inside the complete 67-county property picture.
Open Florida →Download and cite
The files keep existing inventory, industrial development evidence and residential demand context in separate rows with their own dates and labels.
Tampa Bay public aggregate.
Exact project records, addresses, ownership, contacts and source documents remain outside the public file.
SpanVor. “Tampa–St. Petersburg–Clearwater Industrial Market.” SpanVor Industrial Data Atlas, inventory through 2026-08-21; development evidence through 2026-08-21; housing evidence through 2026-09-02. https://spanvor.com/markets/tampa