Travis is the established core
More than 10,800 tracked property records and about 173 million square feet of known building area sit in Travis County.
SpanVor Industrial Data Atlas / Austin
Austin’s industrial market is larger than Travis County and more varied than the technology headlines suggest. This five-county view follows the established property base through Travis, Williamson and Hays, then puts a carefully reviewed development estimate beside the housing growth that supports local operators.
What stands out
Travis County holds the most tracked properties, but Williamson and Hays together carry slightly more known industrial building area. That split matters: the central operating base and the north-south growth corridor are not the same industrial story.
More than 10,800 tracked property records and about 173 million square feet of known building area sit in Travis County.
Williamson and Hays together contribute about 5,000 property records and 182 million square feet of known building area.
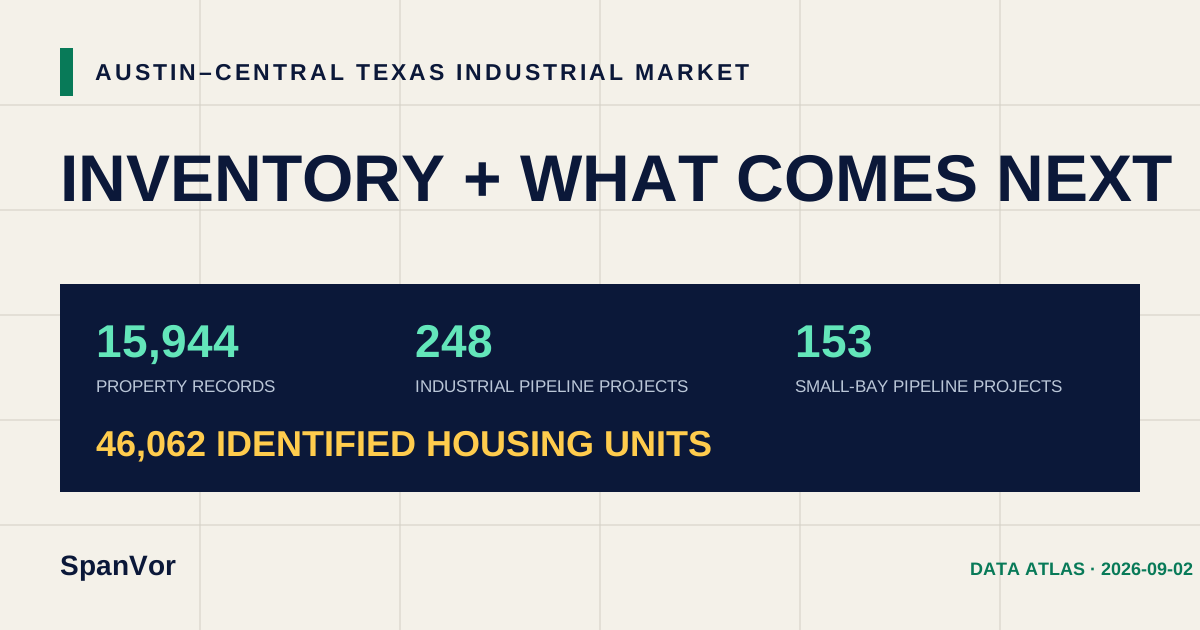
The 248-project corrected estimate includes 61 recovered projects that cannot yet be split cleanly between current and planned.
County inventory
Property records are not one-for-one buildings or available suites. Building area and tenant observations help reveal the operating scale behind each county count.
| Rank | County | Property records | Small-bay records | Known building SF | Tenant records |
|---|---|---|---|---|---|
| 1 | TravisFIPS 48453 | 10,819 | 10,721 | 173M | 66,417 |
| 2 | WilliamsonFIPS 48491 | 3,544 | 3,446 | 137M | 20,094 |
| 3 | HaysFIPS 48209 | 1,466 | 1,436 | 45.4M | 9,196 |
| 4 | CaldwellFIPS 48055 | 95 | 25 | 543.6K | 14 |
| 5 | BastropFIPS 48021 | 20 | 19 | 288.4K | 21 |
What comes next
The corrected measured estimate excludes 12 exact net-new rows whose source lifecycle or work scope contradicts active new industrial supply. The evidence is preserved as nonadditive audit history.
Inventory coverage
14,182 of 15,944 records carry usable building area, or 88.9%. Tenant observations cover 12,843 property records.
Review the current public industrial-development lens.
Open Supply →Growth contextAustin DemandFollow housing and other local development signals.
Open Demand →State comparisonTexas industrial dataPlace this market inside the statewide property and county picture.
Open Texas →Download and cite
The files keep existing inventory, industrial development evidence and residential demand context in separate rows with their own dates and labels.
Austin public aggregate.
Exact project records, addresses, ownership, contacts and source documents remain outside the public file.
SpanVor. “Austin–Central Texas Industrial Market.” SpanVor Industrial Data Atlas, inventory through 2026-08-21; development evidence through 2026-08-21; housing evidence through 2026-09-02. https://spanvor.com/markets/austin-central-texas