Tarrant County records
Tarrant is the largest county aggregate in the nine-county view, followed by Dallas, Denton and Collin. Property-record conventions can influence the comparison.
SpanVor Industrial Data Atlas / Dallas-Fort Worth
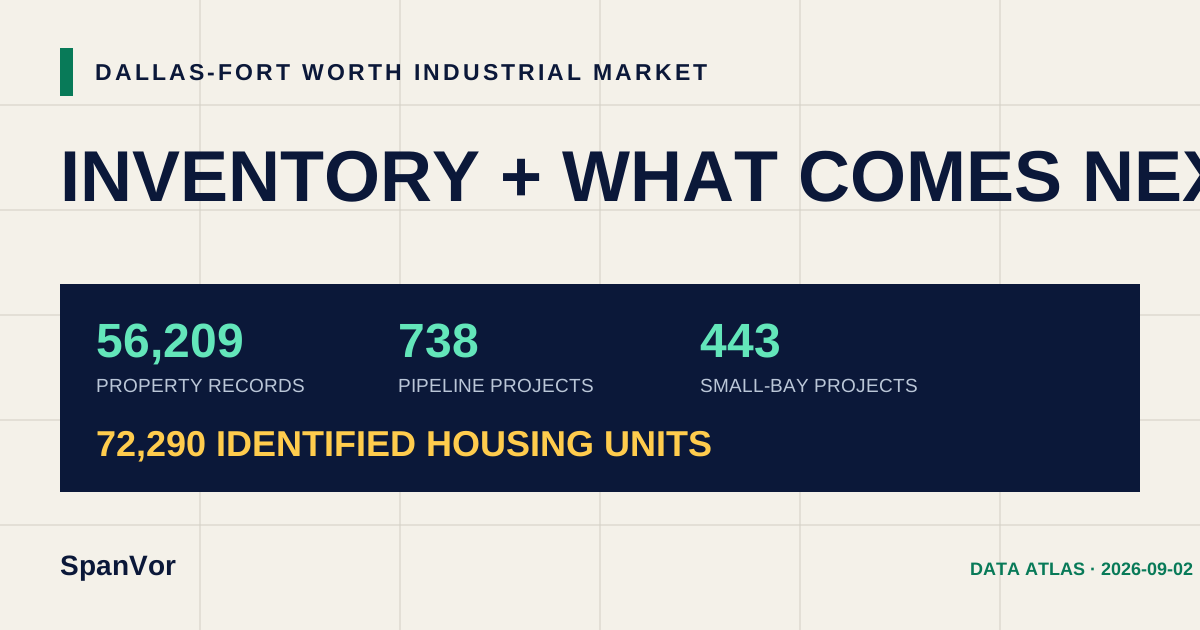
A business park already standing, a warehouse under construction and a planned residential community are different signals. This page keeps them separate—then puts them together as a practical view of where DFW industrial property exists and what may shape demand next.
What stands out
DFW contains about 1.4B square feet of known industrial building area in SpanVor’s tracked records. But the opportunity does not distribute evenly across the metro.
Tarrant is the largest county aggregate in the nine-county view, followed by Dallas, Denton and Collin. Property-record conventions can influence the comparison.
This square-foot figure covers the recovered-project subset—not all 738 projects. Unknown square footage stays outside the total.
About 60% of the published pipeline minimum sits in the confirmed or probable small-bay universe.
Nine-county inventory
County counts describe tracked property records. They do not measure vacancy, current listings, suite count or one-for-one physical buildings.
| Rank | County | Property records | Small-bay records | Known building SF | Tenant records |
|---|---|---|---|---|---|
| 1 | TarrantFIPS 48439 | 24,203 | 23,500 | 554.8M | 150,588 |
| 2 | DallasFIPS 48113 | 12,001 | 11,561 | 422.4M | 94,598 |
| 3 | DentonFIPS 48121 | 11,059 | 10,930 | 173.5M | 24,358 |
| 4 | CollinFIPS 48085 | 7,116 | 6,746 | 178.1M | 33,494 |
| 5 | EllisFIPS 48139 | 1,464 | 1,392 | 50.2M | 3,735 |
| 6 | KaufmanFIPS 48257 | 204 | 52 | 9.8M | 39 |
| 7 | JohnsonFIPS 48251 | 89 | 83 | 3.4M | 47 |
| 8 | ParkerFIPS 48367 | 57 | 51 | 1.3M | 31 |
| 9 | HoodFIPS 48221 | 16 | 11 | 149.6K | 6 |
What comes next
The published industrial total is a reviewed minimum. Residential units are a separate demand-context measure. Neither is a vacancy forecast.
Held outside the active total: 136 later project identities remain in audit because the source mix includes certificates of occupancy, terminal statuses, tenant improvements and supporting work. They are visible in the release disclosure but are not quietly added to make the headline larger.
Inventory coverage
37,991 of 56,209 DFW records carry usable building area, or 67.6%. Tenant observations cover 42,728 property records.
Review the current public industrial and small-bay development lens.
Open Supply →Growth contextDFW DemandFollow residential, employer, retail, healthcare, education and infrastructure signals.
Open Demand →State comparisonTexas industrial dataPlace DFW inside the statewide property and county picture.
Open Texas →Download and cite
The files keep inventory, industrial development and residential demand in separate rows with their own dates and scopes.
DFW public aggregate.
Exact proprietary project records, addresses, ownership, contacts and source documents remain outside the public file.
SpanVor. “Dallas-Fort Worth Industrial Market.” SpanVor Industrial Data Atlas, inventory through 2026-08-21; development evidence through 2026-08-20. https://spanvor.com/markets/dfw