SpanVor’s first published DFW view found 415 industrial projects. We said it was a lower bound.
It was more of a lower bound than we realized.
After expanding the permit review, reconciling more official records and making another classification pass, the measured DFW pipeline stands at at least 738 industrial projects. 443 of them fall into the confirmed or probable small-bay universe.
A later pass identified another 136 net project candidates, including 123 classified as small-bay. We are holding that entire increment outside the active total while we adjudicate certificate-of-occupancy records, terminal statuses, tenant improvements, retail work and supporting permits. The evidence is useful. It is not yet clean enough to call future supply.
That is more than double the first published industrial view—and it changes the conversation.
DFW does not merely have a few headline distribution centers underway. It has a remarkably broad development pipeline stretching from major warehouses and manufacturing facilities to flex parks, contractor-oriented projects and smaller multi-tenant industrial buildings.
For an owner, investor, developer or broker, that pipeline is both opportunity and competition. The important question is no longer whether new industrial supply is coming. It is what kind, where, and for which tenants.
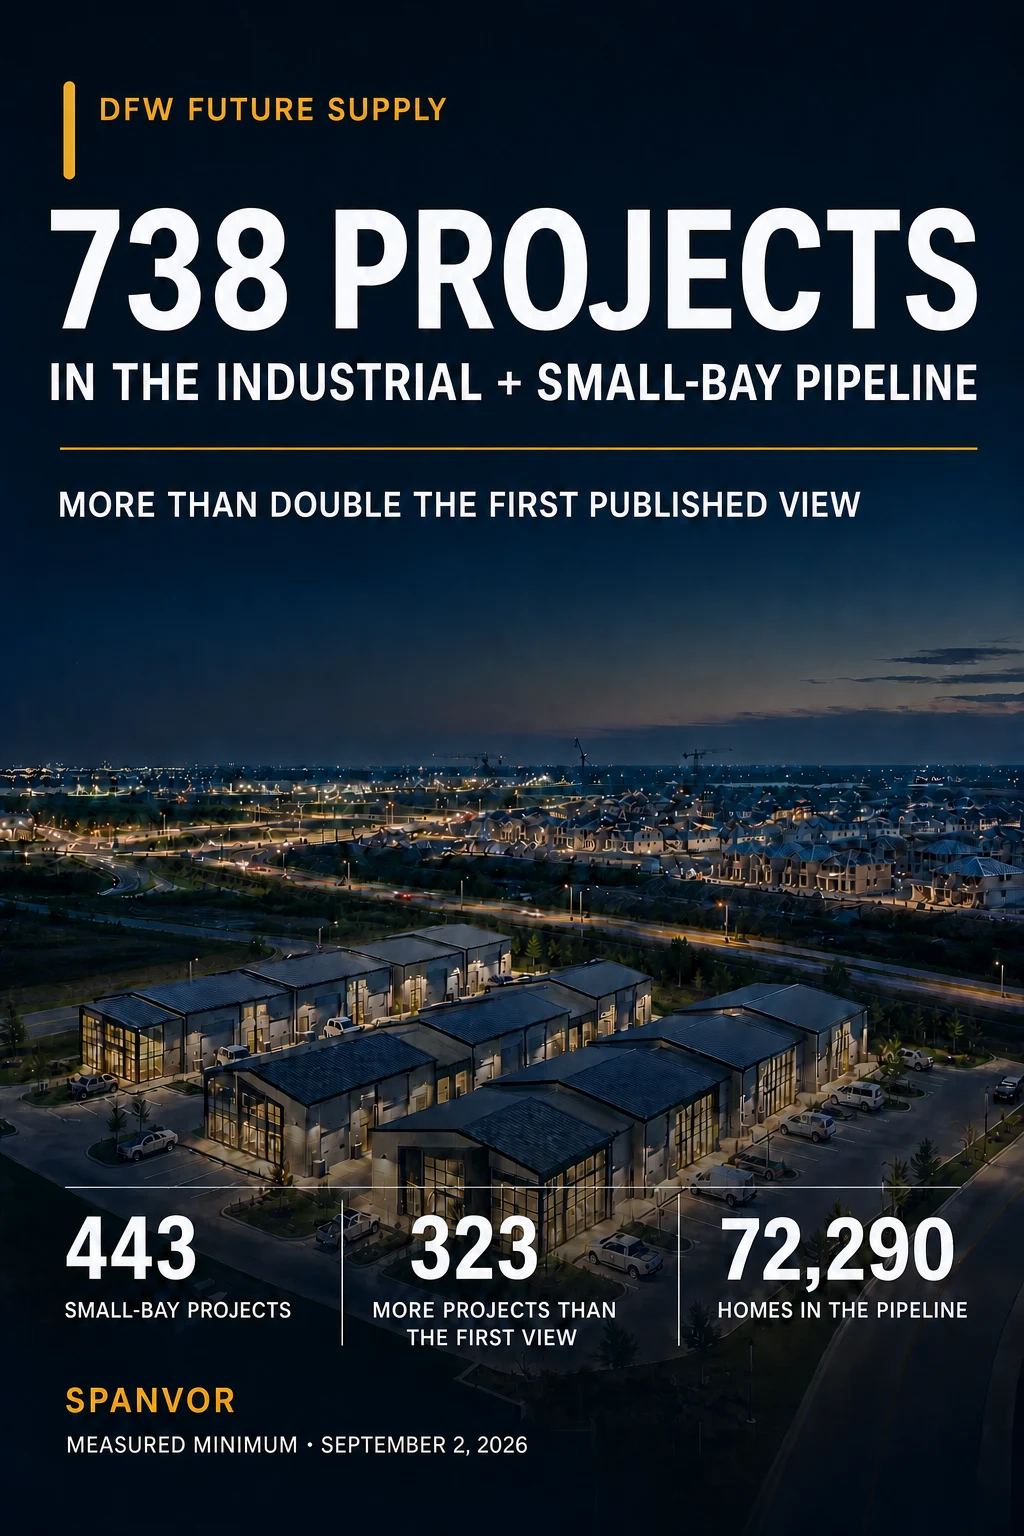
The 72,290-home residential pipeline remains the supporting demand context. More rooftops do not automatically create industrial leases, but they do create service calls, construction work, equipment needs, deliveries, repairs and thousands of local businesses that cannot operate from a laptop or a storefront.
THE DFW READ IN ONE SENTENCE: SpanVor now sees at least 738 industrial projects in the pipeline, including 443 small-bay projects; the next opportunity depends on whether that new space is being built in the right format and the right location for DFW’s working economy.
What changed?
DFW did not suddenly add hundreds of industrial projects in a week. Our view got better.
The original article was built from the project-level layer then available on SpanVor. It showed 415 industrial projects, including 259 confirmed or probable small-bay projects. A larger permit-recovery pass subsequently brought the measured aggregate to 738 pipeline projects and 443 small-bay projects. That remains the public minimum.
The final August 21 pass proposed lifting those figures to 874 and 566. A subsequent row-level audit found enough lifecycle and work-scope contradictions that we are not using the extra 136 projects or 123 small-bay classifications in the active headline today.
Here is the progression:
| Published view | Industrial pipeline | Small-bay universe | What changed | | --- | ---: | ---: | --- | | First DFW article | 415 | 259 | Original visible project-level evidence lane. | | Expanded permit recovery | 738 | 443 | Hundreds of additional official-source projects were reviewed and reconciled without adding the prior recovery twice. | | Current measured minimum | 738 | 443 | Reviewed official-source projects that remain in the active pipeline view. | | Later R2 increment · held | +136 | +123 | Preserved for row-level adjudication; not added to the active totals. |
The result is not a claim that every permit record is a separate building. The work reconciles records into reviewed physical projects and removes known overlap before they enter the released aggregate.
It is also not a complete census. DFW contains hundreds of local authorities, permitting systems and project paths. Some are fully accessible. Some provide only reports, keyed searches or partial histories. The number will continue to improve as more records are connected and reviewed.
That is precisely why a lower-bound view is useful. It can get stronger without pretending the first number was the whole market.
The square-foot headline needed to change too
The first article led with at least 18.6 million square feet because that was the building area stated across the project records then available.
That figure remains part of the earlier evidence, but it no longer describes the expanded pipeline.
The subsequent permit-recovery layer separately carried 25.9 million square feet across its recovered pipeline projects. The later R2 review found still more candidate records, but it did not publish a consolidated square-foot total for the measured 738-project minimum—and the 136-project increment is not active supply until its lifecycle and work scope are resolved.
So we are not replacing the old 18.6-million-SF headline with a made-up larger one. The honest current headline is the measured project count and product mix: at least 738 industrial projects, including 443 small-bay projects. The consolidated square-foot total will return when the underlying records support it cleanly.
About three-fifths of the measured pipeline touches the small-bay universe
The 443-project small-bay view represents about 60% of the measured industrial pipeline.
That does not mean every one of those projects is a textbook 2,500-square-foot contractor bay. The small-bay universe includes both confirmed and probable matches. Some projects are clearly multi-tenant flex or shallow-bay developments. Others have enough physical or descriptive evidence to be probable but still need more detail.
Even with that limitation, the scale matters.
Small-bay development is often discussed as though it is a minor footnote to DFW’s big-box market. The updated record says otherwise. Smaller industrial formats are being planned and built across the metro in meaningful numbers. The challenge for a market participant is separating the projects that truly compete for local operating tenants from everything else wearing an industrial label.
A large cross-dock warehouse does not compete with a 4,000-square-foot HVAC bay. A single-tenant manufacturing plant does not replace a 10-building flex park. A self-storage facility may compete for land, but it does not create the same suite inventory.
That is why product classification matters as much as the total.
A large pipeline is not automatically too much supply
Seven hundred thirty-eight projects sounds enormous because it is enormous.
But DFW is not one neighborhood, one tenant pool or one industrial market. It is a collection of submarkets spread across a vast region. A project in Forney does not necessarily compete with an infill park in Farmers Branch. A new building near Alliance may do little for a service business whose customers and employees are concentrated in Plano.
The metro also has substantial growth behind it:
- 72,290 homes are identified in the current under-development and planned residential pipeline.
- Health care, schools, retail, infrastructure and employment projects are expanding the operating economy around those rooftops.
- Construction and population growth create demand from contractors, repair businesses, distributors, fabricators, automotive users, recreation operators and other local companies that use small-bay space.
The 72,290 homes are not a lease forecast. They are context. The real question is whether functional industrial space is arriving near that growth—and whether it has the doors, power, parking, yards, access and permitted uses the resulting businesses need.
Where should DFW market participants look first?
The expanded aggregate strengthens the metro story, but the opportunity is still local.
North Collin County
Frisco, Prosper, Celina, McKinney, Allen and the surrounding growth corridor combine residential expansion with a growing industrial and flex pipeline. The opportunity is not simply to build more space. It is to understand whether incoming projects offer the smaller suites, parking, loading and local access needed by the businesses serving that growth.
Alliance and north Fort Worth
This remains one of the metro’s most visible supply corridors. It contains major logistics and manufacturing activity as well as smaller projects serving the surrounding ecosystem. Product type matters enormously here: a large warehouse total can hide a much tighter market for functional local bays.
The DFW core and infill corridors
Dallas, Farmers Branch, Irving, Garland, Mesquite, Grand Prairie and Arlington contain deep existing inventory alongside new activity. New supply competes not only with other new construction but with older parks being renovated, re-tenanted or repositioned. This is where building function and location can matter more than age.
East DFW, the southern belt and Denton County
The first project-level analysis treated portions of these corridors as potential supply gaps. The expanded review means those conclusions should now be tested against the added records rather than repeated automatically. They remain strong research areas because residential and commercial growth is visible, but the new industrial universe needs to be placed on the map before calling any corridor underserved.
That distinction matters. Better data should change the question when it changes the evidence.
What the update means for owners
An owner should use the pipeline as an early-warning system.
If new competing small-bay projects are appearing nearby, the response may be to renew good tenants earlier, address deferred maintenance, improve signage, restripe parking, add secure yard area or document power and loading before the new product delivers.
If most nearby construction is big-box, the owner may have less direct competition than the broad industrial headline suggests.
The comparison should be physical: suite sizes, office finish, clear height, doors, power, parking, yard, access and permitted uses. “Industrial” is not a competitive set.
What the update means for brokers
For brokers, every new project is a possible assignment, tenant move or source of market intelligence.
The 738-project measured pipeline creates prospecting paths on both sides of the transaction. Developers need land, financing, leasing and sales advice. Existing owners need to understand future competition. Tenants need help separating functional options from nominally available space.
The most useful broker will not merely repeat the metro construction total. The useful broker will know which projects create new 3,000-, 8,000- or 15,000-square-foot choices in a specific submarket—and which do not.
What the update means for developers and investors
For developers, 443 small-bay projects are not a reason to abandon the format. They are a reason to get more precise.
Where are the new projects concentrated? Which corridors are adding rooftops and local businesses faster than practical bays? What suite sizes are being delivered? Is parking sufficient? Is outdoor storage legal? Does the power support fabrication or equipment-intensive users? Can service vehicles enter and leave without fighting retail traffic?
For investors, the same questions help identify both risk and resilience. An existing park can remain highly defensible in a growing corridor if new construction targets a different tenant or lacks the features local operators require.
Why the live project list and the aggregate are different
The released 738-project figure is the current measured minimum. SpanVor’s detailed public project workspace still contains a separate project-and-opportunity layer with public-safe cards and mapped locations.
The later R2 review identified 136 additional candidate projects, including 123 classified as small-bay, but a follow-up audit found mixed lifecycle and work-scope evidence. Those candidates remain visible as an audit cohort rather than being added to the active aggregate while project identities, locations, statuses and classifications are reconciled.
This is deliberate. It is better to publish a defensible market total with a clear limitation than to force incomplete project details onto a public map.
The bottom line
The first DFW view found 415 industrial projects. The current measured view finds at least 738, with another 136 candidate projects under review.
That does not invalidate the original idea. It makes the original point stronger: broad industrial headlines are not enough, and the first number visible in fragmented public records is rarely the whole story.
DFW has a very large incoming industrial pipeline. About three-fifths of the measured minimum sits in the confirmed or probable small-bay universe. At the same time, more than 72,000 homes and a wide field of commercial and civic development are moving through the region.
The opportunity is in the intersections—and the mismatches.
Owners need to know where real competition is coming. Brokers need to know where listings and tenant movement will emerge. Developers need to know where growth still lacks functional space. Investors need to distinguish a scary metro total from the projects that can actually compete with a particular asset.
That is what the updated DFW view is built to do.
FAQs
Are all 738 projects under construction?
No. The 738 figure combines planned and under-development pipeline projects. The reviewed release does not publish a complete split between those two stages, so SpanVor does not invent one.
Are the 443 small-bay projects additional to the 738?
No. The 443 confirmed or probable small-bay projects are a classification within the 738-project industrial pipeline.
Why did the project count rise from 415 to 738?
SpanVor expanded its official-source permit review, reconciled more project records and completed another classification pass. The increase reflects better coverage and review—not 323 projects suddenly breaking ground. A further 136 candidates remain outside the headline until their lifecycle and work scope are resolved.
Why is there no updated total square-foot figure?
The reviewed release did not publish a consolidated building-area total for all 738 measured projects. Earlier layers contain stated square footage, but using the old 18.6-million-SF figure as the current pipeline total would now understate the expanded view.
Does the 72,290-home pipeline predict 72,290 industrial tenants?
No. It is residential growth context, not a tenant count, lease forecast, vacancy forecast or absorption model.
Where can I see the DFW data?
Explore the live DFW demand map and DFW supply map on SpanVor.
Methodology
SpanVor’s DFW supply-and-demand view combines reviewed official permits, plans, plats and retained local-development records. The public aggregate retains the 738-project / 443-small-bay reviewed minimum. A later R2 pass proposed 136 additional project identities, including 123 small-bay classifications; those records remain a nonadditive audit cohort because certificate-of-occupancy records, terminal statuses, tenant improvements, retail work and supporting permits are mixed into the source review. The release does not publish a complete current/planned split, a confirmed/probable small-bay split, or a consolidated pipeline square-foot figure. Detailed project cards remain withheld until their public identities, locations and classifications are ready for project-level release. Residential figures count identified dwelling units in under-development and planned records and remain separate from industrial projects and other-demand leads.
This article is educational and strategic, not investment, legal, tax or financing advice.