The server hall gets photographed. The contractor yard across the road usually does not.
That yard—and the bays behind it—may be the more interesting real estate story for industrial owners.
A large data center campus can pull in electrical contractors, cooling specialists, controls firms, equipment suppliers, fiber crews, testing companies, security providers, parts distributors and logistics operators. Some need a 500,000-square-foot warehouse. Others need a 5,000-square-foot bay, a fenced acre for equipment or a flex building close enough to respond when downtime is measured in dollars per minute.
This surrounding economy is the data center halo.
Recent leasing research suggests the halo is already material. Cushman & Wakefield studied more than 388 million square feet of industrial leasing across six major data center markets from 2022 through 2025. Data-center-related businesses represented 10.4% of new industrial leasing over the period and 14.4% in 2025. In Dallas, they represented 22% of the new leasing within the size range studied.
The tempting conclusion is that every proposed campus creates an automatic industrial boom.
That would be too easy—and wrong.
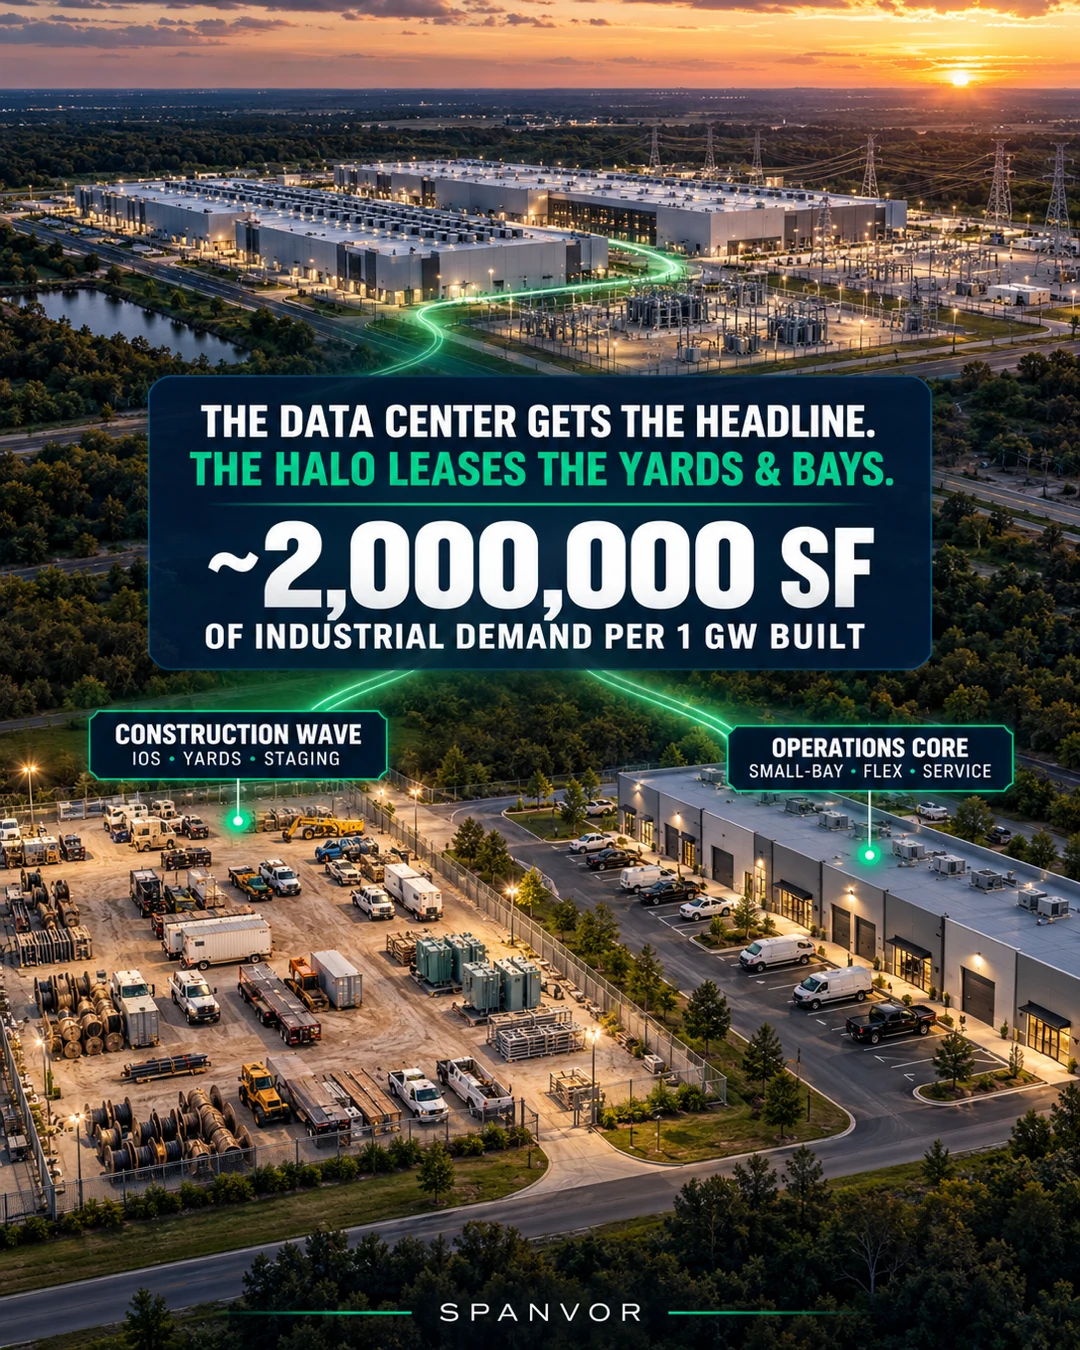
The useful conclusion is that a data center creates two very different leasing markets: a fast, highly visible construction wave and a quieter, more durable operations core. Small-bay, flex and industrial outdoor storage can serve both. The value lies in knowing which one you are actually leasing to.
The finding, in five numbers
- 14.4%: data-center-ecosystem businesses' share of new industrial leasing in 2025 across six markets studied by Cushman & Wakefield.
- 22%: the share in Dallas, the highest of those six markets.
- 365,000 square feet per 100 megawatts: Cushman & Wakefield's average associated industrial leasing estimate across the six markets.
- About 2 million square feet per gigawatt: Link Logistics' separate estimate of spillover industrial demand across the data center vendor ecosystem.
- About 80%: Link Logistics' estimate of the spillover demand tied to ongoing operations rather than construction staging.
The two square-foot estimates are not interchangeable. They come from different portfolios, markets and methods. I would not average them, and I certainly would not multiply either one by every announced gigawatt on a tracker.
What they do establish is the order of magnitude: the industrial effect around a genuinely advancing gigawatt-scale campus can be measured in millions of square feet, not a few contractor sheds.
The next question is where that demand actually lands.
The halo is not one tenant pool
The businesses surrounding a campus need different buildings at different times.
| Campus phase | Who shows up | Likely real estate need | Duration | |---|---|---|---| | Site and utility work | Civil, electrical, utility and fiber contractors | IOS, equipment yards, fleet parking and basic warehouse space | Project-driven | | Vertical construction | General contractors, specialty trades, prefabrication and equipment vendors | IOS, flex, staging warehouses and temporary field operations | Often 18–36 months | | Commissioning | Controls, testing, network, power and cooling specialists | Smaller flex and technical service space near the campus | Can bridge into operations | | Ongoing operations | Maintenance, cooling, electrical, fire/life-safety, security, server service and parts providers | Small-bay, flex, service industrial, parts storage and selective IOS | Potentially long-lived | | Expansion phases | A new mix of construction and operations vendors | Another wave layered onto the established halo | Repeats with each phase |
This matters because “data center tenant” can describe two companies with entirely different risk.
One may be leasing a yard for cable reels, trailers and transformers until Phase One is energized. Another may be stocking critical cooling parts and maintaining equipment across five campuses for the next decade.
Both are real demand. Only one should be underwritten as durable without more evidence.
Where small-bay and flex fit
The largest supplier requirements often land in bulk warehouse space. Link Logistics has disclosed a 740,000-square-foot lease in Columbus for a third-party logistics provider storing data center components, and an Atlanta-area property where infrastructure suppliers occupy most of an 852,935-square-foot logistics center.
That does not make the halo only a big-box story.
The campus still needs a long list of companies whose operating model fits smaller space:
- Electrical, generator, switchgear and uninterruptible-power-system service firms.
- HVAC, liquid-cooling, plumbing and water-treatment contractors.
- Building controls, commissioning and systems-testing companies.
- Fire protection, security, access-control and monitoring providers.
- Fiber, network and telecommunications crews.
- Server maintenance, specialty repair and reverse-logistics operators.
- Tool, lift, fleet and equipment-service businesses.
- Parts distributors that need inventory close enough for urgent response.
- Local fabricators and prefabrication teams.
- Janitorial, landscape, waste and other recurring facility-service companies.
These are not all “tech tenants.” Many look like the same practical local businesses already occupying small-bay parks. The difference is the customer on the other side of the service ticket—and the urgency attached to it.
For this group, the ideal property may have little in common with the data center itself. It may be an older flex building with useful power, a grade-level door, fleet parking and fast access to the campus. It may be a shallow-bay park where a vendor can combine office, parts storage and field service. It may be an IOS yard that can legally store equipment and vehicles without a zoning fight.
The data center is the anchor. The halo tenant may be the small-bay or IOS occupier.
IOS may feel the construction wave first
Data center construction is unusually equipment- and material-intensive. Transformers, generators, chillers, cooling skids, switchgear, cable, steel, trailers and heavy equipment do not arrive in a neat sequence and disappear directly into the building.
They have to be stored, staged, inspected and moved.
That makes IOS especially relevant early in the development cycle. A well-located fenced yard can support laydown, fleet parking, containers, modular equipment and subcontractor operations before the campus is producing a single unit of computing capacity.
But the same feature that creates the opportunity creates the risk. Link Logistics says construction-phase users often sign leases of only one to three years. A yard can look irreplaceable at peak construction and become ordinary the moment the last phase is commissioned.
The underwriting questions should therefore be painfully specific:
- Which campus and phase supports the tenant's contract?
- Is the tenant working on construction, ongoing operations or both?
- When is the relevant phase expected to reach completion?
- Are additional phases funded, permitted and utility-supported—or merely announced?
- Can the property serve ordinary industrial users if the halo recedes?
I would happily collect construction-wave rent. I would be reluctant to capitalize it as permanent income without knowing the answers.
Where is the development concentrated?
The largest published data center pipeline is not confined to Northern Virginia anymore.
As of its August 2026 update, dcmap.us reported the following published or announced pipeline power among tracked markets:
| Market | Reported pipeline power | |---|---:| | Dallas–Fort Worth | 12.9 GW | | Northern Virginia | 11.3 GW | | Phoenix | 8.3 GW | | Chicago | 5.6 GW | | Atlanta | 5.5 GW |
Those figures are a watchlist, not a leasing forecast. The tracker itself notes that the industry has no standard counting unit: a campus, a building and a hall can each appear as one project. Published power figures can also refer to different scopes and measures. Planned capacity is not the same thing as energized capacity.
Still, the geography lines up with what industrial landlords are already reporting. Cushman & Wakefield's six-market leasing study covered Atlanta, Austin/San Antonio, Chicago, Dallas, Phoenix and Virginia. Link Logistics has specifically identified Atlanta, Dallas, Phoenix and Columbus as markets where the supplier ecosystem is becoming visible.
For SpanVor, that suggests a better way to follow this trend than ranking press releases by megawatts.
The real signal is stage plus proximity plus property fit
A useful data center halo map would not stop at a pin showing the campus.
It would connect four layers:
- Project reality: planned, permitted, under construction, commissioning or operating.
- Phase and timing: which part is advancing and when the construction wave may peak.
- Nearby industrial capacity: small-bay, flex, bulk warehouse and legally usable IOS within a practical service radius.
- Change on the ground: contractor-yard permits, tenant improvements, supplier arrivals, land-use filings and new industrial leasing.
That is where the opportunity becomes measurable.
A five-gigawatt announcement with no secured utility path should not carry the same weight as a 300-megawatt phase with active site work. A mature colocation facility should not be assumed to create the same local vendor network as a multi-phase hyperscale campus. Brookings' study of approximately 1,500 facilities found that the telecommunications employment gain appeared around hyperscale campuses but not around colocation facilities.
The format matters. The stage matters. The surrounding property stock matters.
What owners, brokers and developers should watch
For an owner, the best data center halo tenant may be a durable maintenance or service company whose lease is modest but whose location is mission-critical.
For a broker, the opportunity is to map the vendors before they become obvious tenants: the electrical distributor, cooling specialist, controls contractor and equipment-service company following awarded work into a new market.
For a developer, the discipline is avoiding a permanent building program sized entirely to a temporary peak. Divisible bays, adaptable loading, adequate power, sensible parking and usable yard can make a project relevant to both the construction wave and the operating economy that follows.
And for anyone underwriting the theme, the question is not simply, “How many data centers are nearby?”
It is: Which projects are actually advancing, what phase are they in, and which businesses will still need space after the cranes leave?
That is the data center halo worth tracking.
Frequently asked questions
What is the data center halo?
The data center halo is the secondary economy of contractors, suppliers, logistics providers, maintenance firms and other service companies that forms around the construction and operation of a data center campus.
How much industrial demand can a data center create?
Published estimates vary. Link Logistics estimates about 2 million square feet of spillover industrial demand per gigawatt of data center construction. Cushman & Wakefield estimates about 365,000 square feet of associated industrial leasing per 100 megawatts across six studied markets. These are directional industry estimates, not a universal formula.
Which properties can benefit?
Bulk warehouses can serve equipment logistics, while small-bay and flex buildings can house service contractors, parts providers, controls firms and maintenance vendors. IOS can support equipment, materials, trailers, fleet and construction staging.
Is the demand permanent?
Some is and some is not. Construction staging can create a strong one-to-three-year leasing wave. Operations, maintenance and critical-parts demand can last much longer. Tenant function and campus phase must be verified before treating the income as durable.
Which U.S. markets have the largest reported pipelines?
The August 2026 dcmap.us ranking placed Dallas–Fort Worth, Northern Virginia, Phoenix, Chicago and Atlanta at the top by published or announced pipeline power. Project stages and the credibility of announced capacity vary.
How this analysis was built
This article combines the September 21, 2026 Campus Halo research brief with published 2026 research from Cushman & Wakefield, Link Logistics and Brookings, plus the August 2026 dcmap.us development tracker. Tracker totals were not combined because project definitions, lifecycle labels and power measures differ among sources.
The industrial-demand figures describe broad industrial leasing and spillover demand, not small-bay demand alone. The small-bay, flex and IOS discussion identifies the property formats that fit specific vendor activities; it does not assign every square foot of the estimated halo to those formats.
Key takeaways
- Data centers create industrial demand outside the campus through contractors, equipment suppliers, logistics providers and operations vendors.
- The halo has two parts: a temporary construction wave and a more durable operations core.
- Cushman & Wakefield found data-center-related businesses represented 14.4% of new industrial leasing in 2025 across six studied markets—and 22% in Dallas.
- Small-bay and flex fit recurring service, maintenance, parts and technical vendors; IOS fits equipment, fleet and construction staging.
- A proposed gigawatt is not a lease forecast. Project stage, campus type, utility reality and nearby industrial stock determine whether the halo becomes real.
Explore SpanVor's national industrial development pipeline, industrial property statistics and public market profiles for Dallas–Fort Worth, Phoenix and Atlanta.
SpanVor tracks industrial properties and development activity across the United States. You can explore the property-level platform with 14 days of SpanVor All-Access—no credit card—at spanvor.com/trial.
One last thing, since you read this far: the code SpanvorBlog takes 25% off a SpanVor Pro subscription—where the property-level data behind posts like this one lives.
Written by Jason Probert, Founder of SpanVor—Industrial Property Intelligence.
Sources
- Cushman & Wakefield, “AI Infrastructure Boom Fuels Growing Wave of Industrial Demand Beyond the Data Center,” July 23, 2026
- Link Logistics, “How Data Center Construction Is Driving Warehouse Demand Across the U.S.,” updated August 2026
- Brookings, “New evidence on data center employment effects,” 2026
- dcmap.us, U.S. Data Center Map, updated August 2026